• About
  • Special Reports
  • Topics
    • Climate
    • Earth Science
    • Oceans
    • Space & Planets
    • Health & Ecosystems
    • Culture & Policy
    • Education & Careers
    • Opinions
  • Projects
    • Postcards From the Field
    • ENGAGE
    • Editors’ Highlights
    • Editors’ Vox
    • Eos en Español
    • Eos 简体中文版
    • Print Archive: 2015–2025
  • Policy Tracker
  • Blogs
    • Research & Developments
    • The Landslide Blog
  • Newsletter
  • Submit to Eos
  • AGU.org
  • Career Center
  • Join AGU
  • Give to AGU
  • About
  • Special Reports
  • Topics
    • Climate
    • Earth Science
    • Oceans
    • Space & Planets
    • Health & Ecosystems
    • Culture & Policy
    • Education & Careers
    • Opinions
  • Projects
    • Postcards From the Field
    • ENGAGE
    • Editors’ Highlights
    • Editors’ Vox
    • Eos en Español
    • Eos 简体中文版
    • Print Archive: 2015–2025
  • Policy Tracker
  • Blogs
    • Research & Developments
    • The Landslide Blog
  • Newsletter
  • Submit to Eos
Skip to content
  • AGU.org
  • Career Center
  • Join AGU
  • Give to AGU
Eos

Eos

Science News by AGU

Support Eos
Sign Up for Newsletter
  • About
  • Special Reports
  • Topics
    • Climate
    • Earth Science
    • Oceans
    • Space & Planets
    • Health & Ecosystems
    • Culture & Policy
    • Education & Careers
    • Opinions
  • Projects
    • Postcards From the Field
    • ENGAGE
    • Editors’ Highlights
    • Editors’ Vox
    • Eos en Español
    • Eos 简体中文版
    • Print Archive: 2015–2025
  • Policy Tracker
  • Blogs
    • Research & Developments
    • The Landslide Blog
  • Newsletter
  • Submit to Eos

A. Becel

Associate Editor, JGR: Solid Earth

Figures showing modeling of fault related anisotropy
Posted inEditors' Highlights

Fault Related Anisotropy in the Hikurangi Subduction Zone

by A. Becel 13 January 20218 July 2024

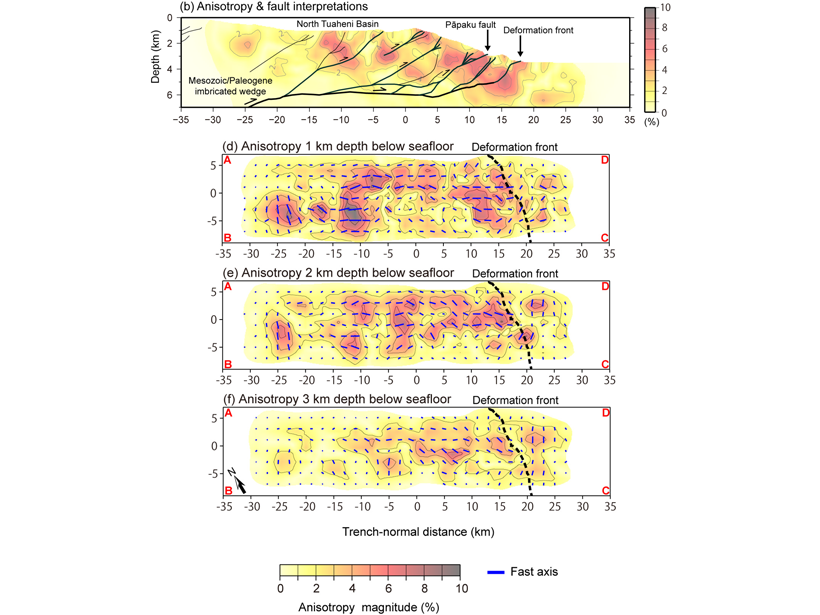
A new study provides the first high-resolution three-dimensional anisotropic P-wave velocity model of the shallow part of the Northern Hikurangi subduction zone offshore New Zealand.

New global map of the depth of the base of the Earth’s crust, also called the Moho boundary.
Posted inEditors' Highlights

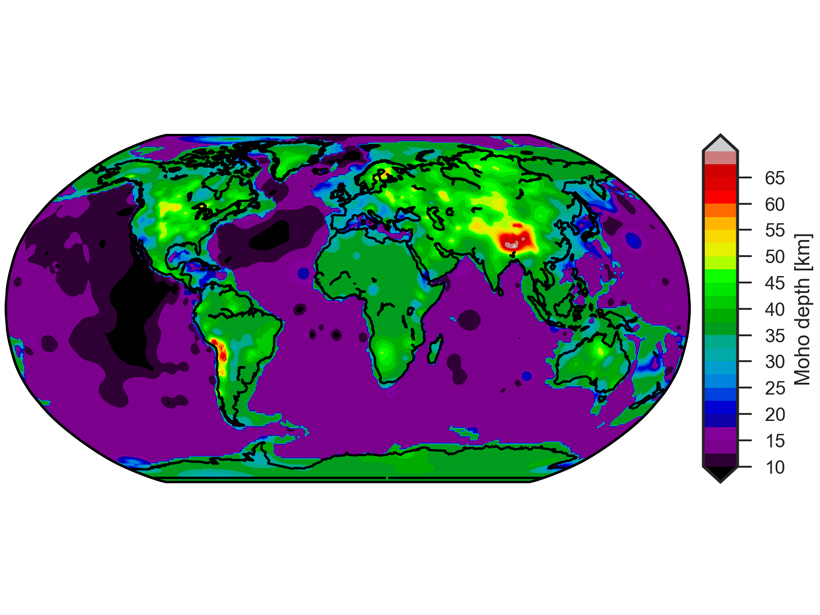
New Global Crustal Model Built as Foundation for Future Studies

by A. Becel 14 March 201914 January 2022

A new global crustal model and its corresponding uncertainty were obtained using minimum a priori information and a geostatistical approach.

Over a dark blue-green square appear the words Special Report: The State of the Science 1 Year On.

Features from AGU Publications

Research Spotlights

Making a Map to Make a Difference

11 February 202611 February 2026
Editors' Highlights

A New Way to Measure Quartz Strength at High Pressure

13 February 202612 February 2026
Editors' Vox

A Double-Edged Sword: The Global Oxychlorine Cycle on Mars

10 February 202610 February 2026
Eos logo at left; AGU logo at right

About Eos
ENGAGE
Awards
Contact

Advertise
Submit
Career Center
Sitemap

© 2026 American Geophysical Union. All rights reserved Powered by Newspack