California’s governor declared the end of the state’s 5-year drought emergency in April 2017, and the dry spell that at times covered more than half the state left many wondering whether climate change was to blame.
But scientists looking to answer that question often face a troubling conundrum: The earliest measurements of drought conditions were taken long after climate change had already begun reshaping the landscape.
“In order to know if something is unusual [in the present day], you generally have to rely on climate models to estimate preindustrial variability,” said climate scientist Kate Marvel at NASA and Columbia University. “I was interested in finding a way around that.”
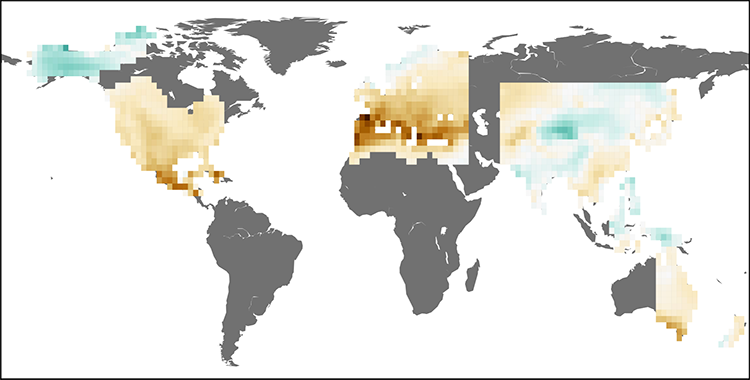
The new maps combine data from thousands of tree rings and give “an incredible picture of global drought conditions.”
A study released 1 May in the journal Nature uses historical tree ring data to track the influence of fossil fuel emissions on drought conditions around the globe over the past century. According to the new research, fossil fuel emissions had a detectable effect on the global hydroclimate as early as 1900, forcing some areas to grow drier and others to grow wetter over time. The study is the first to test the variations of global droughts in the past and attribute them to human actions.
A Parched Past
The research team traced droughts through history using tree rings dating back to the 1400s. Each tree ring’s thickness reflects how moist the soil was during that year of the tree’s life, and soil moisture can be used as the basis for a scientific metric for drought called the Palmer drought severity index. Past studies used the tree ring record and the related drought index to create detailed maps of drought over time for North America, Australia–New Zealand, Asia, Europe, and the Mediterranean. (South America’s maps are under way, and Africa remains too data sparse to adequately map.)
Marvel, one of the first authors on the paper, said that the maps combine data from thousands of tree rings and give “an incredible picture of global drought conditions.”
Marvel and her coauthors then mined the regional maps to determine the natural variation in drought conditions since the 1400s and compared them with 20th-century tree ring data and other on-the-ground observations, like root soil moisture and temperature. Finally, they turned to models to test for a discernible human fingerprint.
Three Trends
The paper detected three distinct trends in drought conditions over time:
First, starting at the turn of the 20th century when they began their fingerprint analysis, the records showed a skew toward more drought and wet climates above the level of natural variation seen in centuries prior. Swaths of Central and North America, Europe, Australia, western Russia, Southeast Asia, and the Mediterranean dried out. At the same time, areas of central Canada, Indonesia, central Asia, the Indian subcontinent, and western China grew wetter. The paper called the link between fossil fuels and the changes across the globe a “robust” signal during this time period.
“This [trend] is something that is very, very unlikely to have arisen through natural variability alone,” said Marvel.
By the midcentury, however, circumstances changed. The second trend noted in the paper found that the robust signal gave way to noise between 1950 and 1975, and the paper found no discernible link between drought and greenhouse gas emissions. The study’s authors suggest that the downward trend came about from tiny airborne particles, called aerosols, accumulating in the atmosphere. Burning fossil fuels releases soot, dust, and other pollutants into the air, and these small particles of pollution can seed clouds and block solar radiation.
The years since 1981 mark the final trend in the record. Government regulation halted the unbridled release of aerosols into the atmosphere, and their effects weakened. Most recently, the research indicates that fossil fuel emissions are again at work worsening drought conditions, but Marvel said that they will need to wait until midcentury to know for sure.
“We can’t say definitively that it has yet emerged from the backdrop of natural climate variability,” Marvel noted. “But we can see that signal begin to emerge.”
Their projections spell out a drier future for places like the American Southwest, said Marvel.
Dry Spells to Come?
Overall, Marvel said that the study is a complement to research attributing worsening instances of drought, such as California’s drought or Syria’s recent drought, to climate change. But the present study doesn’t necessarily point out drought conditions over the past century that would have been noticeable to people at the time.
“Even if you do not live in a place that is directly affected, everything is interconnected.”
“We’re talking about a signal emerging over a really long time, over incredibly wide swaths of land,” she said. The effects of future droughts increasing, which the study predicts, could be wide-ranging.
“There are going to be people moving from places that are affected. There will be disruptions to agriculture,” Marvel said. “Even if you do not live in a place that is directly affected, everything is interconnected.”
Alexis Berg, an associate research scholar at Princeton University studying terrestrial hydrology who was not involved in the study, calls the research a “first of its kind” look into attributing drought to human-caused emissions but also raised concerns about the use of the Palmer drought severity index.
“While it’s a good and convenient metric for monitoring drought spatially at a given point in time, studies have shown that it may not be a good metric for assessing possible long-term trends in drought,” he noted.
Marvel agreed that the index had limitations but called the method a “necessary evil.”
“The best thing to do is to directly observe the soil moisture. But we’ve only been doing that for a couple of decades,” she said.
Marvel noted that past records of soil moisture and the drought index have been largely in agreement. The issue lies in making future projections, because the impacts of future climate change, like heat stress altering plant processes, could affect soil moisture in a way that isn’t considered by the index. In future research, she plans to address the intricacies of plant behavior on drought conditions to help whittle away at these uncertainties.
“That’s the source of really exciting scientific research going forward,” Marvel said.
—Jenessa Duncombe (@jrdscience), News Writing and Production Intern
Citation:
Duncombe, J. (2019), Burning fossil fuels worsens drought, Eos, 100, https://doi.org/10.1029/2019EO122733. Published on 01 May 2019.
Text © 2019. AGU. CC BY-NC-ND 3.0
Except where otherwise noted, images are subject to copyright. Any reuse without express permission from the copyright owner is prohibited.
Text © 2019. AGU. CC BY-NC-ND 3.0
Except where otherwise noted, images are subject to copyright. Any reuse without express permission from the copyright owner is prohibited.