The year 2015 was the warmest year on record. The average global temperature surpassed the averages of any other year measured so far, announced NASA and the National Oceanographic and Atmospheric Administration (NOAA) in a joint teleconference on Wednesday, 20 January.
The two agencies independently collected data from about 6300 meteorological stations around the world, ship- and buoy-based instruments, and Antarctic research stations to separately determine their own global average temperature estimates. The NASA investigation found the average was 0.87°C higher than the norm, which it defines as the average temperature between 1951 and 1980, whereas the NOAA team found a 0.90°C increase over their baseline, the time period spanning 1901–2000. The year 2014 was the previous hottest year on record, and it registered 0.74°C above average.
Both the NOAA and NASA 2015 data sets show remarkably large jumps in the average global temperature compared to 2014’s record figure.
Both the NOAA and NASA 2015 data sets show remarkably large jumps in the average global temperature compared to 2014’s record figure, said Thomas Karl, director of NOAA’s National Centers for Environmental Information in Asheville, N.C. According to NOAA, the temperature rose by around 0.16°C in 2015 over 2014, whereas NASA tallied a 0.13°C increase. Comparing 2014 to the prior record (2010), NOAA and NASA found much smaller increases of 0.04°C and 0.02°C, respectively.
North Atlantic Chill
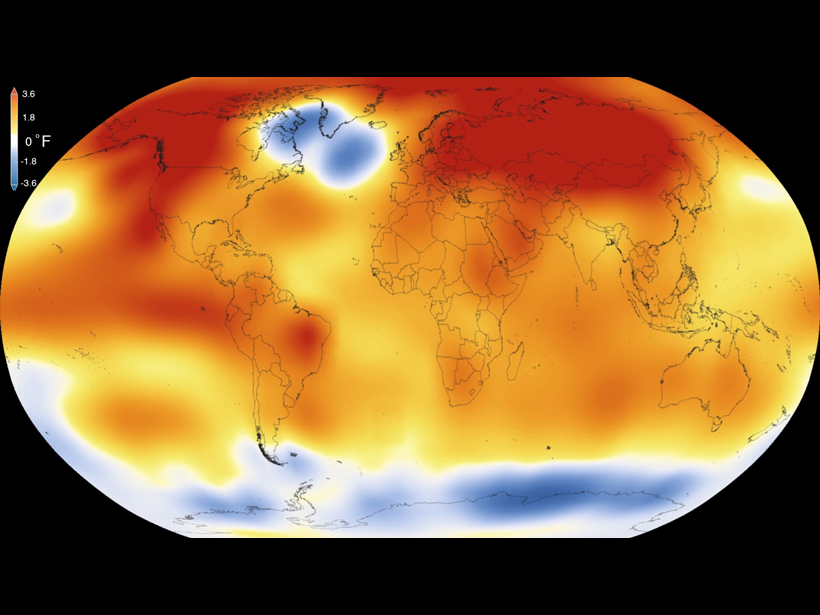
Although the warmth spanned the globe, a large and striking cold spot blossomed in the North Atlantic—some areas within the region even experienced record low temperatures. Gavin Schmidt, director of NASA’s Goddard Institute for Space Studies in New York, told Eos that the cooler temperatures could be a result of a change in how deep water circulates in the Atlantic Ocean. Warm waters normally move northward in the Atlantic Ocean. However, greenhouse gas emissions can slow down and weaken Gulf Stream currents, said Karl.
Although the warmth spanned the globe, a large and striking cold spot blossomed in the North Atlantic.
Jessica Blunden, a NOAA climate scientist in Asheville, N.C., who authors the monthly and yearly temperature reports discussed during the teleconference, said that the cool region in the North Atlantic is an area of active research, but it could be the result of the Gulf Stream, an arm of the global “conveyor belt” of currents, slowing down or from cold meltwater running off Greenland into the ocean.
El Niño and the Blob
As the North Atlantic anomalously cooled, other parts of the world took the warming to a higher level. An El Niño pattern, in which tropical eastern Pacific waters heat up considerably, took shape toward the end of 2015 and has continued into this year. Also, although it’s not easy to spot on the map above, an unusual region of ocean water persisted throughout last year off the U.S. Pacific Northwest. This warm patch, dubbed the “warm blob” or just “the blob,” set up much of the weird, intensely dry weather seen on the West Coast last year, said Schmidt.
During their teleconference, both Schmidt and Karl said to expect a warm year again in 2016, perhaps warm enough to break the record 2015 just set.
—Cody Sullivan, Writer Intern
Citation: Sullivan, C. (2016), Record global warmth in 2015, but some places bucked the trend, Eos, 97, doi:10.1029/2016EO044463. Published on 25 January 2016.
Text © 2016. The authors. CC BY-NC 3.0
Except where otherwise noted, images are subject to copyright. Any reuse without express permission from the copyright owner is prohibited.