
Arctic melt season watchers had a wild ride this year, with sea ice extent plummeting, and tracking with all previous record lows for time-of-year from March through mid-August, as 2019 appeared on course to challenge 2012 — the lowest minimum in the 1979-2019 forty-year satellite record.
Then, once again proving the Arctic’s unpredictability, 2019’s melt slowed dramatically in late August and early September, only to take off again in a race to the bottom. As recently as Monday, extent appeared to be heading toward a fourth place finish behind 2016 and 2007, but overnight 2019 surpassed both, placing second only to 2012. And final results still aren’t in.
“This year what we’re seeing is a good example of the natural variability of the system,” says Mark Serreze, director of the National Snow and Ice Data Center (NSIDC). In the spring, it looked like we were heading for a new record low, but then, in August, the loss rate suddenly slowed.
2019 now ranks among the lowest ice minimums in the 40-year satellite record. More importantly, during the four-decade time frame, the world has witnessed monumental declines in ice extent and volume in the Arctic. “In all months, sea ice extent is going down,” reports Serreze, with the biggest changes seen at the end of the summer melt season. Compared to when the satellite record began in 1979, sea ice extent is down about 40 percent in September. “It’s a big loss,” he says.
By the numbers, the 1979 extent minimum, according to NSIDC, came in at 6.895 million square kilometers (2.662 million square miles), whereas by 2012 the September ice locked in at just 3.340 million square kilometers (1.289 million square miles). This year, as of September 17, sea ice extent sank to 4.100 million square kilometers (1.583 million square miles), shifting its ranking overnight from fourth to second place, surpassing 2007 at 4.147 square kilometers (1,601 square miles) and 2016 at 4.145 square kilometers (1.600 square miles).
In recent years, we’re starting to see more significant losses in other seasons, too, says Julienne Stroeve, a senior research scientist with NSIDC. “The changes in summer have been dramatic, but it’s starting to manifest in other seasons as well, with later freeze-up and earlier melt. We’re lengthening the [progressively] ice-free season.”
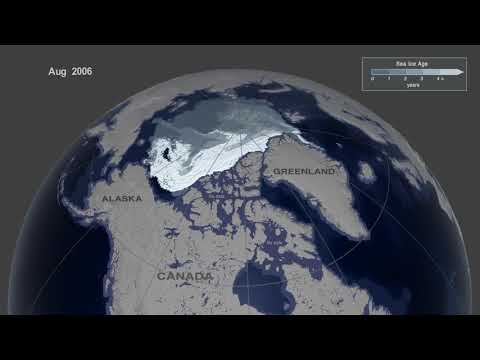
And sea ice isn’t only covering far less extent, it’s also getting thinner causing the volume of Arctic ice to drop precipitously, making the sea ice far more vulnerable to warming Arctic waters and atmosphere. With less thick, multiyear ice hanging around much of the sea ice in the Arctic is forming and melting away every year.
In 1979, the daily minimum for sea ice volume was 17,065 cubic kilometers (4,094 cubic miles). While 2019 has likely not yet reached its lowest point, at the end of August, volume had fallen to just 4,170 cubic kilometers (1,000 cubic miles), putting it in close second place behind 2012, and already 75 percent lower than the 1979 minimum.

Such dramatic changes in the ice are being driven by warmer air and water temperatures which eat away at the ice from all sides. Summers are longer than they used to be, and winters are warmer. “You put that together and you have a pretty strong formula for getting rid of ice,” says Serreze.
Still, that doesn’t mean ice loss has followed a clear downward trajectory with every year lower than the one that came before. Rather, based on the natural variability of the climate and summer weather patterns, the trend of sea ice extent creates a kind of “sawtooth pattern,” where year-to-year extent and volume vary, but the long-term trend is ever downward, in what has been dramatically dubbed “the Arctic Death Spiral.”

Thus far, 2012 has experienced the lowest September sea ice cover in the satellite record. “It sticks out like the proverbial sore thumb,” says Serreze. But low years are increasingly more frequent and recent, with the top ten all occurring after 2007. And if global temperatures continue to rise — as expected in a world where nearly no nations are currently expected to meet their Paris Climate Agreement goals — that melting trend is bound to spiral downward.

How Ice Loss Affects Us All
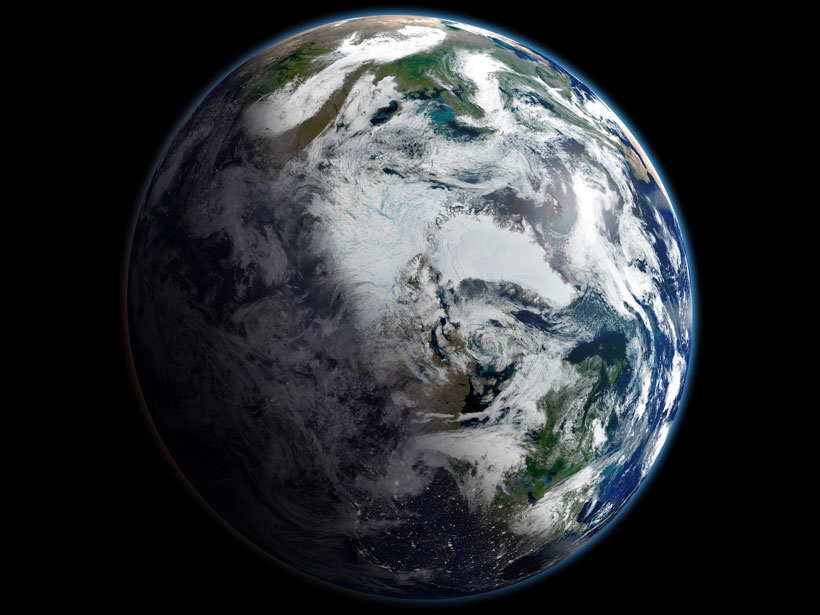
With so few long-term climate data sets, the importance of the sea ice record is hard to overstate. Sea ice is an extremely sensitive indicator of changes in the global climate, and it’s also very visual — unlike, say, changes in the global average air temperature. “You look at satellite data and you can very well see what’s happening,” says Serreze. And then there are those stunning pictures of beleaguered polar bears whose feeding habits are impacted by sea ice loss — with other polar species seriously affected too.
However, climate change is now becoming increasingly visual beyond the Arctic, with impacts ranging from devastating hurricanes to long-term droughts and raging wildfires. One metaphor says that the polar regions act as the Earth’s air conditioners, while also helping to set up many of the basic weather patterns that we have come to expect around the globe in the past. But as the Arctic grows out of sync, so goes the rest of the planet,
“A strongly warming Arctic could influence weather patterns in the mid-latitudes,” says Serreze. As the saying goes: what starts in the Arctic, doesn’t stay in the Arctic.
Researchers are increasingly certain that the strong temperature differentials between the Arctic and the temperate zone are one of the primary factors that create and propel the northern jet stream — a fast-moving river of air in the Northern Hemisphere that circles the Arctic. As sea ice vanishes and Arctic temperatures increase, the temperature variant between these regions is getting smaller. That means there’s less force driving the winds in the jet stream from west to east, and the weakened jet stream starts to swing wildly, deviating from its typical polar path into lower latitudes (even as far south as the Gulf of Mexico) which can also cause temperate weather patterns to stall in place — bringing punishing bouts of extreme weather.
This spring saw one of the waviest jet streams in recent history, and in turn, severe weather slammed into much of the mid-latitudes. Bomb cyclones, severe thunderstorms, heavy rain and catastrophic flooding in the Mississippi River basin were all possibly born out of this year’s deeply askew jet stream. One possible impact could be the stalling of major storms, such as Hurricane Harvey over Houston, Texas; that storm’s stuck-in-place rainfall totals topped 60 inches in some locales.
The unprecedented melting of sea ice has other serious ramifications. Less ice means the Arctic is now open for business. The world’s superpowers are paying increasingly more attention to northern economic opportunities, and the region is now considered to be of significant geopolitical importance. US President Donald Trump’s sudden interest in Greenland is just one example. That country made headlines this summer for another reason, seeing a huge amount of glacial melt into the North Atlantic. Scientists now estimate that ice loss in Greenland this year alone was enough to raise the average global sea level by more than a millimeter — glacial melt that is only expected to escalate, unless the world’s nations and corporations act aggressively to limit greenhouse gas emissions.
The Arctic has large deposits of natural gas, oil and rare earth minerals, as well as methane hydrates, that if mined, would likely be game over for reestablishing a stable global climate. Moreover, the loss of ice has opened up shipping routes, such as the Northern Sea Route over Russia, and the Northwest Passage in Canada. “Right now, both [routes] are open. It’s pretty much clean sailing,” says Serreze. “I’ve been studying the Arctic years, but now I’ve unavoidably been drawn into issues of climate change and geopolitics.”
Future of Forecasting
Despite the 40-year record, it’s still difficult for ice scientists to know how the melt season will shake out each year. Ice predictions are constrained by limited forecasting abilities for the natural variations in weather.
Scientists like Stroeve are working on ways to improve measurements of sea ice thickness, which helps to inform ice forecasts. Currently, researchers aren’t able to directly map sea ice thickness in summer (relying on modeling for their statistical analysis), and are limited by how much snow lies atop the ice in other months. “That’s something we don’t observe well from satellites. Our understanding is pretty rudimentary. We have to make assumptions based on snow depths,” she says.
The other big barrier in predicting sea ice outcomes is the accuracy of long-term weather forecasts. Right now, scientists can’t predict how natural variations in weather will impact the ice in the long run. Stroeve calls this the “spring predictability barrier,” which means that any ice forecast made before May isn’t very accurate. “Once you get to June, things get better.”
In a sense, long range forecasts are easier. Without governmental and corporate action to curb carbon emissions, the global trend in Arctic sea ice will almost certainly be downward — with impacts both seen and as yet unforeseen, for us all.
This story originally appeared in Mongabay. It is republished here as part of Eos’s partnership with Covering Climate Now, a global collaboration of more than 250 news outlets to strengthen coverage of the climate story.