When it comes to Earth’s warming climate, record-breaking surface temperatures make the headlines—but the full depths of the world’s oceans bear the brunt of the change. Climate plays a central role in the processes that influence marine ecosystem health and biodiversity throughout the oceans. These processes include heat retention, the melting of polar ice, ocean circulation, nutrient supply, and the primary production of organic compounds.
Climate change has now altered these processes throughout the seas. The effects vary by region, and they are significant, altering the ocean’s carbon cycle from the surface, where photosynthetic organisms fix carbon from the atmosphere, all the way through the water column to the seafloor, where carbon can be sequestered. Recent Intergovernmental Panel on Climate Change reports suggest that changes in climate and ocean processes will continue and likely increase.
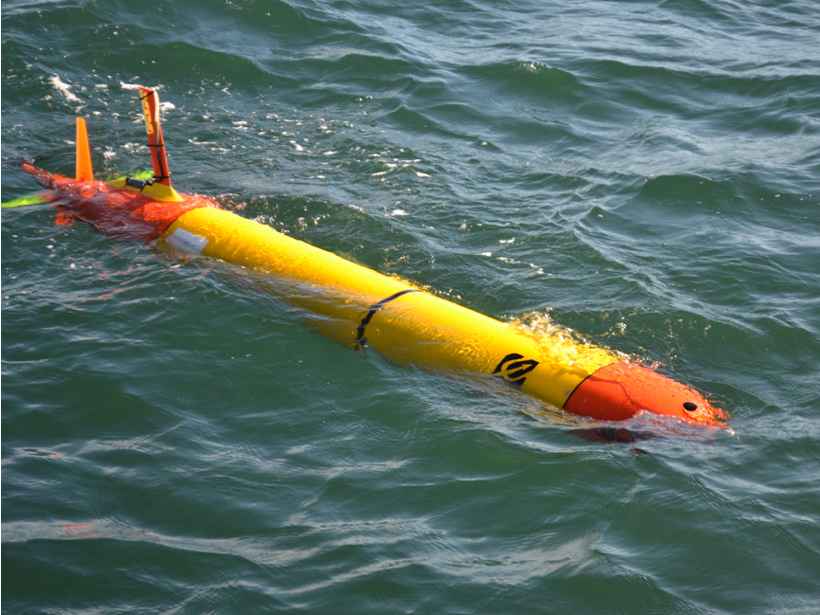
In order to monitor these changes to our oceans, scientists collect data sets of repeated measures that keep track of the ocean’s vital signs over time—also known as time series data. The data can be collected from buoys moored at a fixed point in the water or from robotic mobile vehicles like the Makai autonomous underwater vehicle (AUV, shown above). Maintaining the continuity of these long-term oceanic time series studies—and ensuring that they have sufficient spatial and temporal resolution—is essential to understanding and potentially mitigating these ongoing changes [Henson, 2014].
The current direction of oceanic time series research needs strategic reassessment.
However, the current direction of oceanic time series research needs strategic reassessment. Rising costs and coverage gaps are threatening our future monitoring capabilities. In order to overcome these challenges, scientists will have to expand their use of autonomous ocean technologies and increase international coordination and collaboration. Efforts toward those ends have already improved numerous time series programs, and funding agencies and nongovernmental organizations should consider prioritizing support for them in their long-term plans for oceanographic research.
Financial Sustainability
Scientists and management agencies alike stress the need to improve resolution and predictive capabilities of climate models through improved data collection and analysis. However, one of the major challenges of sustaining long time series studies in the open ocean is the long-term financial and logistical commitment that is required—not only for routine maintenance but also for continuously integrating new technologies. For example, the United States is struggling to maintain its research fleet in the face of rising costs and increasing demands for oceanographic measurements [Kintisch, 2015; National Research Council, 2015].
Ship operating costs rose by 61% between 2003 and 2011 for University National Oceanographic Laboratory System vessels [National Ocean Council, 2013], and fuel costs skyrocketed by about 400% for U.S. and European fleets. This trend has already restricted research cruises and will likely increasingly do so in the longer term, especially to remote areas of the ocean.
Current Time Series Monitoring Coverage Gaps
Major holes in geographic, vertical, and temporal coverage present another challenge to the strength of scientific conclusions about global change based on global time series data sets, particularly when it comes to biological measurements. Over two thirds of Earth’s surface is covered by ocean, with a mean depth of ~4000 meters.
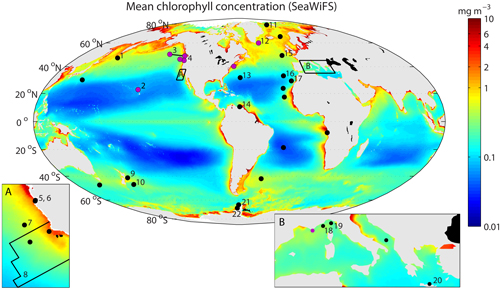
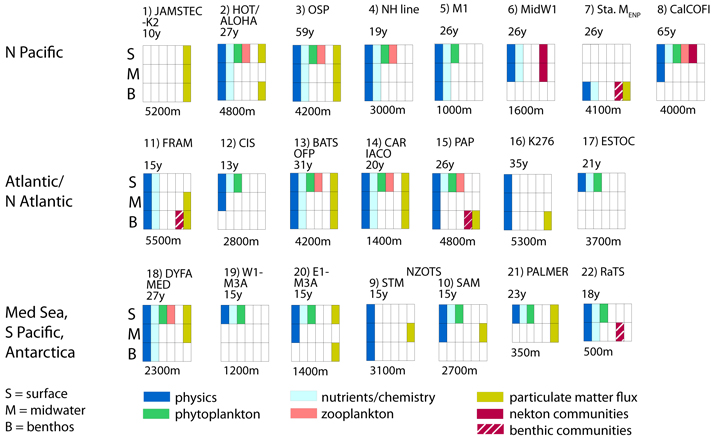
About 40 oceanic time series stations worldwide are operational, with data being collected and archived, sampling biogeochemical and/or ecological data at seasonal or more frequent intervals (some of these are shown in Figure 1). The vast majority of these time series stations are located along continental coasts, where the waters teem with the organisms that produce chlorophyll and the food webs they support. Only two are positioned out in the middle of oceans, where chlorophyll is low. There are major geographical gaps in time series coverage in the South Pacific and Indian Oceans, as well as in the climate-sensitive but remote and harsh polar regions.
Furthermore, the ocean’s depths are not evenly sampled—as depth increases, the amount of oceanographic monitoring decreases, and observations targeting biological communities often disappear (Figure 2). Satellites provide global coverage of the very surface of the ocean, and the Argo network, nearly 4000 free-drifting profilers, has expanded oceanographic observations in all oceanic areas down to depths of 2000 meters. Below that depth, data become scarce. Currently, no operating time series site monitors ecosystems across the full depth of the ocean, from surface to seafloor, using consistent and comparable methods.
The first such site, the Arctic observatory FRAM (Frontiers in Arctic Marine Monitoring), is now funded—an approach that we hope will become more common. However, to gain a better view of biogeochemical processes and marine ecosystems on a global scale below 2000 meters, agencies and organizations must also invest in autonomous mobile technologies.
Platform and Instrumentation Evolution to Long-Range Autonomous Capacities
One of the most promising technologies for time series operations is the emerging class of robotic vehicles that either drift with the current or are self-propelled. This class includes long-endurance gliders, wave gliders, profiling floats, and higher-payload AUVs. Long-endurance AUVs (LEAUVs) can be deployed from shore to carry out months-long monitoring missions that cover up to 6000 kilometers at depths to 6000 meters [Furlong et al., 2012].
A long-range road map for ocean monitoring should consider these long-endurance robotic vehicles. Once they are built, they are very cost effective and can greatly improve the financial sustainability of oceanic time series. They also reduce the need to use research vessels, freeing up ship time for other science activities. Funding agencies should consider prioritizing up-front investments in technology that will lead to long-term savings.
Autonomous mobile assets also represent a significant upgrade in capability. They can offer significantly increased spatial resolution over traditional fixed assets, and long-endurance fleets can exceed the temporal capabilities of ship-based surveys. As satellite telemetry costs come down, AUVs will be able to transmit more of their data to shore. They also have the ability to exchange power and data with fixed moorings, increasing the service duration of these fixed-point assets while minimizing ship intervention. Energy-harvesting buoys (wave, wind, and solar) now in development could power entire fixed observatories and recharge LEAUVs at docking stations. Using LEAUVs and energy-harvesting buoys to improve the maintenance of time series sites could be a transformative step in ocean observation.
Although, in the past, autonomous instruments were limited in their measurement capabilities, they are rapidly improving. AUVs can now support instruments such as high-definition camera systems and multibeam sonar devices and can also retrieve samples. Advanced analysis techniques previously confined to the laboratory, including optical measurements and biogeochemical techniques that require wet reagent reactions, are being miniaturized and optimized to fit inside floats, gliders, and LEAUVs [e.g., Beaton et al., 2012; Moore et al., 2009; Rérolle et al., 2013]. In situ molecular probe assays and flow cytometry are also being developed that could eventually be deployed on AUVs [e.g., Hashemi et al., 2011; Harvey et al., 2012]. It is critical to support the development efforts needed to eliminate remaining technology gaps in autonomous systems for both mobile and fixed platforms.
Intersite Coordination and Calibration
Another way to improve the efficiency and effectiveness of time series research is to create a truly global monitoring system by standardizing and sharing existing sensors, platforms, and data sets. Monitoring the ocean to its full depth with consistently calibrated instrumentation all over the globe—and doing so for decades at a time—is critical to track how global warming impacts the oceans’ ecosystems and biogeochemical processes.
Currently, the types of measurements at each site and the depths at which they are made vary significantly. Each time series project has specific goals—not necessarily to provide coordinated data to a global monitoring system. However, efforts are underway for coordination by Fixed-point Open Ocean Observatories, the European Multidisciplinary Seafloor and Water Column Observatory, the Optimizing and Enhancing the Integrated Atlantic Ocean Observing System (AtlantOS), and globally, the OceanSITES and Ocean Observatories Initiative. Such connectivity should be supported, especially where ship and fixed-platform infrastructures remain the best options for certain measurements and remote regions.
Acknowledgments
Chlorophyll a data for Figure 1 were obtained through the Sea-viewing Wide Field-of-view Sensor (SeaWiFS). This research was supported by the David and Lucile Packard Foundation and by the Helmholtz Association.
References
Beaton, A. D., C. L. Cardwell, R. S. Thomas, V. J. Sieben, F.-E. Legiret, E. M. Waugh, P. J. Statham, M. C. Mowlem, and H. Morgan (2012), Lab-on-chip measurement of nitrate and nitrite for in situ analysis of natural waters, Environ. Sci. Technol., 46, 9548–9556.
Furlong, M. E., D. Paxton, P. Stevenson, M. Pebody, S. D. McPhail, and J. Perrett (2012), Autosub Long Range: A long range deep diving AUV for ocean monitoring, in Autonomous Underwater Vehicles (AUV), pp. 1–7, Inst. of Electr. and Electron. Eng., New York.
Harvey, J. B. J., J. P. Ryan, R. Marin III, C. M. Preston, N. Alvarado, C. A. Scholin, and R. C. Vrijenhoek (2012), Robotic sampling, in situ monitoring and molecular detection of marine zooplankton, J. Exp. Mar. Biol. Ecol., 413, 60–70.
Hashemi, N., J. S. Erickson, J. P. Golden, K. M. Jackson, and F. S. Ligler (2011), Microflow cytometer for optical analysis of phytoplankton, Biosens. Bioelectron., 26, 4263–4269.
Henson, S. A. (2014), Slow science: The value of long ocean biogeochemistry records, Philos. Trans. R. Soc. A, 372, 20130334.
Kintisch, E. (2015), A moment of truth arrives for U.S. ocean science, Science, 347, 463.
Moore, C., A. Barnard, P. Fietzek, M. R. Lewis, H. M. Sosik, S. White, and O. Zielinski (2009), Optical tools for ocean monitoring and research, Ocean Sci., 5, 661–684.
National Ocean Council (2013), Federal oceanographic fleet status report, 41 pp., Washington, D.C.
National Research Council (2015), Sea Change: 2015–2025 Decadal Survey of Ocean Sciences, Natl. Acad. Press, Washington, D.C.
Rérolle, V. M. C., C. F. A. Floquet, A. J. K. Harris, M. C. Mowlem, R. R. G. J. Bellerby, and E. P. Achterberg (2013), Development of a colorimetric microfluidic pH sensor for autonomous seawater measurements, Anal. Chim. Acta, 786, 124–131.
—K. L. Smith Jr., Monique Messié, Alana D. Sherman, Christine L. Huffard, and Brett W. Hobson, Monterey Bay Aquarium Research Institute, Moss Landing, Calif.; email: [email protected]; Henry A. Ruhl, Ocean Biogeochemistry and Ecosystems Group, National Oceanography Centre, University of Southampton Waterfront Campus, Southampton, U.K.; and Antje Boetius, Alfred Wegener Institute Helmholtz Center for Polar and Marine Research and Center for Marine Environmental Sciences, Bremen University, Germany
Citation: Smith, K. L., Jr., M. Messié, A. D. Sherman, C. L. Huffard, B. W. Hobson, H. A. Ruhl, and A. Boetius (2015), Navigating the uncertain future of global oceanic time series, Eos, 96, doi:10.1029/2015EO038095. Published on 28 October 2015.
Text © 2015. The authors. CC BY-NC 3.0
Except where otherwise noted, images are subject to copyright. Any reuse without express permission from the copyright owner is prohibited.