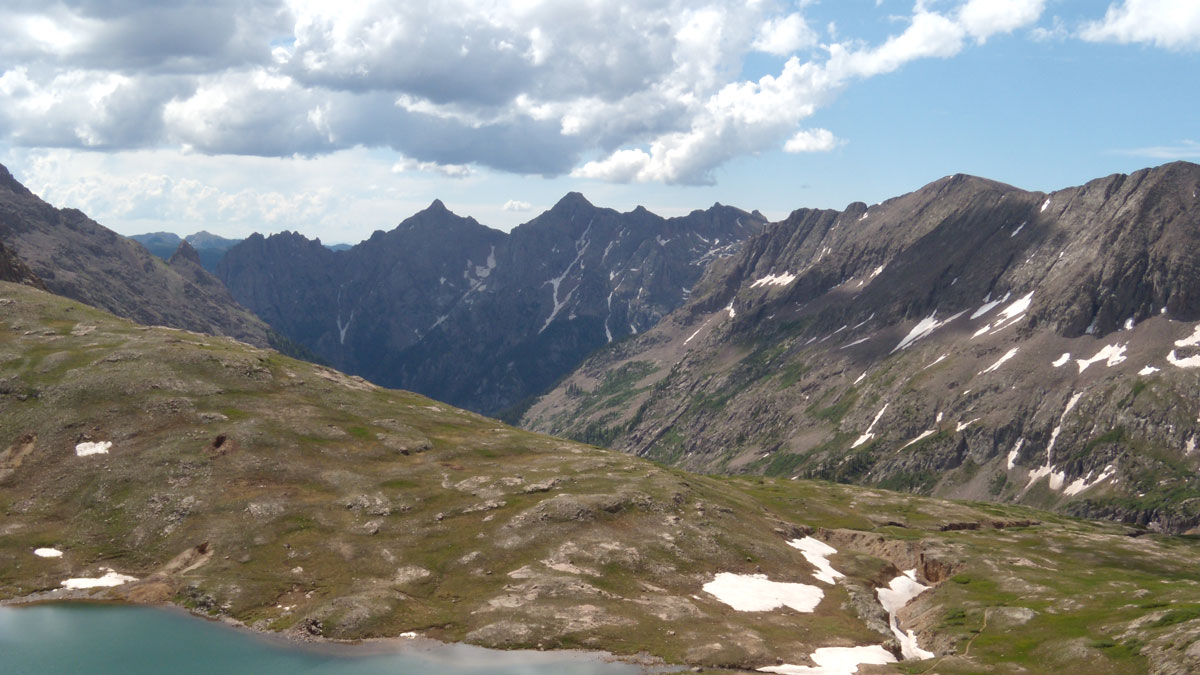
An alpine lake holds traces of how Spanish conquistadors kicked up dust as they colonized the Southwest.
transdisciplinary science

Posted inOpinions
The Genesis Mission Needs Hydrology: Here’s How to Incorporate It
By positioning water security as one of the “most challenging problems of this century,” the Genesis Mission can become the sandbox in which AI reshapes how the United States measures, models, and manages water.

Posted inResearch Spotlights
How to Study Coastal Evolution
Researchers reviewed what’s known about how coastlines are changing and made recommendations for how to learn more.

Posted inFeatures
Small, Faint, or Fast, Rubin Will Find It
The Vera C. Rubin Observatory is set to redraw the map of the solar system by discovering millions of small, fast-moving objects hidden all around us.
Posted inScience Updates
How to Accelerate Advances in Ecological Forecasting
Developing shared cyberinfrastructure can enhance predictions of ecological change and enable improved decisionmaking for resource management and public well-being.

Posted inOpinions
Creating Communities to Help Interdisciplinary Scientists Thrive
Solving complex challenges often requires diverse expertise, but skepticism remains within traditional academic institutions and mindsets regarding interdisciplinary science and scientists.
Posted inNews
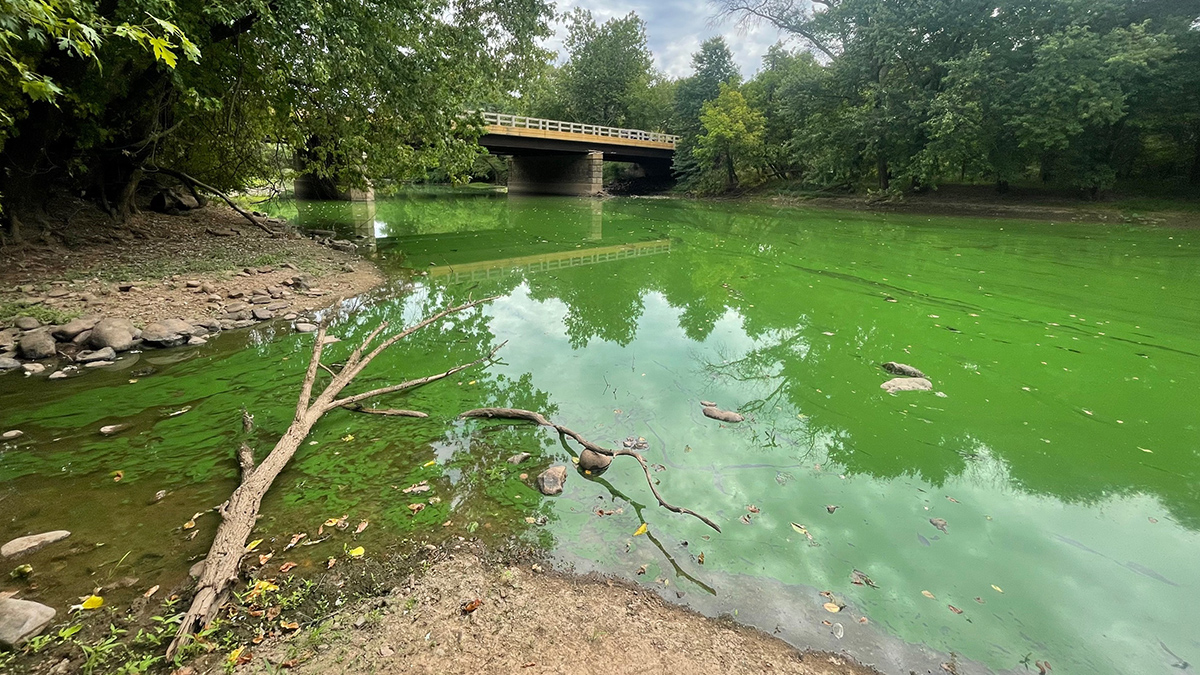
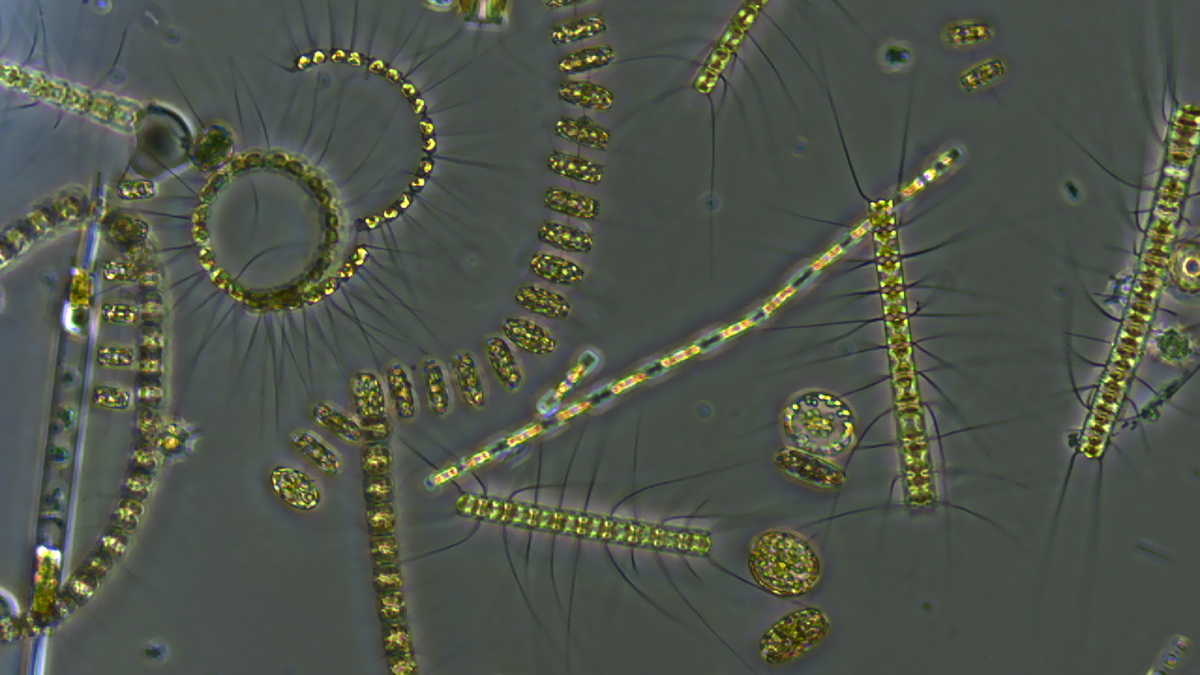
Las olas de calor marinas lentifican el flujo de carbono de los océanos
Cuando el plancton se encuentra en agua caliente, la materia orgánica se estanca en la superficie e interrumpe el transporte de carbono hacia el fondo océanico.
Posted inNews
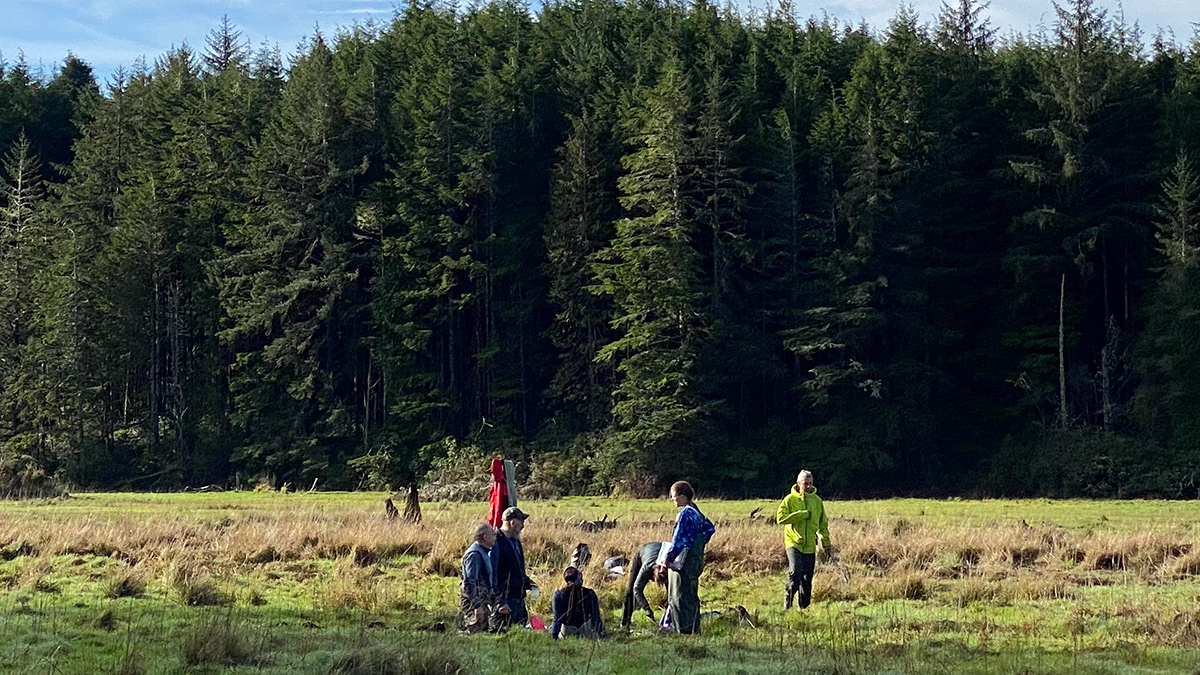
Blending Science and Indigenous Knowledge to Tell an Estuary’s Story
A new study of nutrient levels in soil cores supports oral Indigenous history, informing future estuary restoration efforts.
Posted inNews
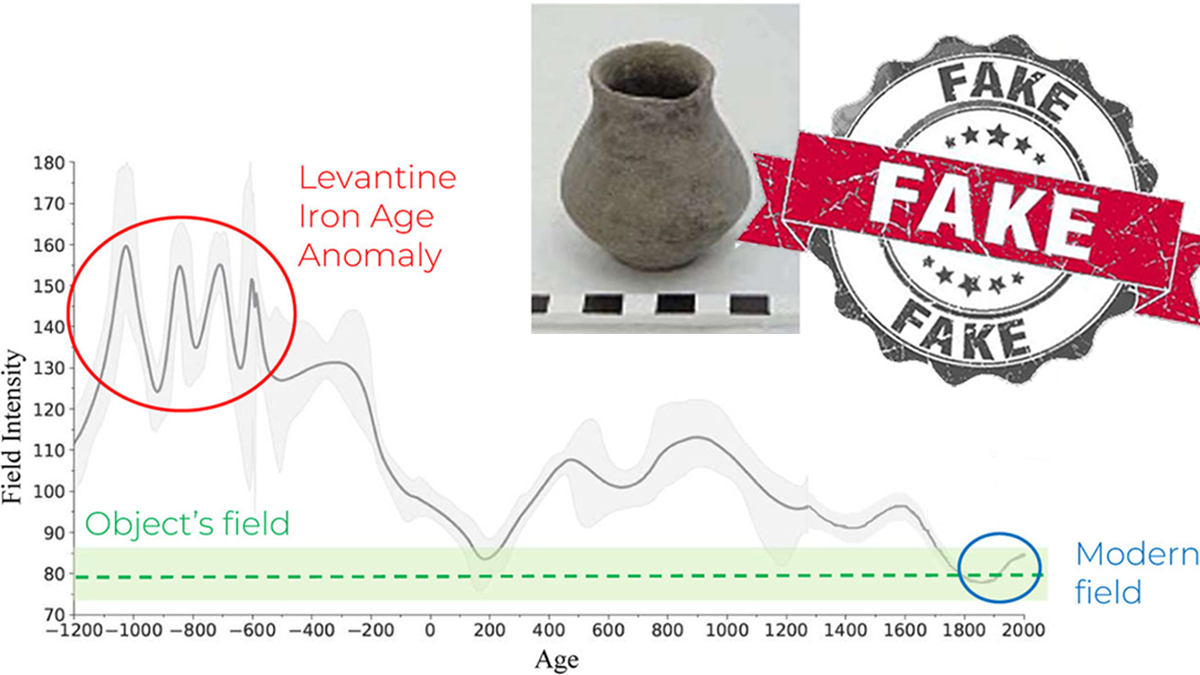
Credible or Counterfeit: How Paleomagnetism Can Help Archaeologists Find Frauds
Duplicating artifacts that preserve records from biblical times is a lucrative business. A method used for both dating artifacts and reconstructing Earth’s history could identify phony pieces.
Posted inNews
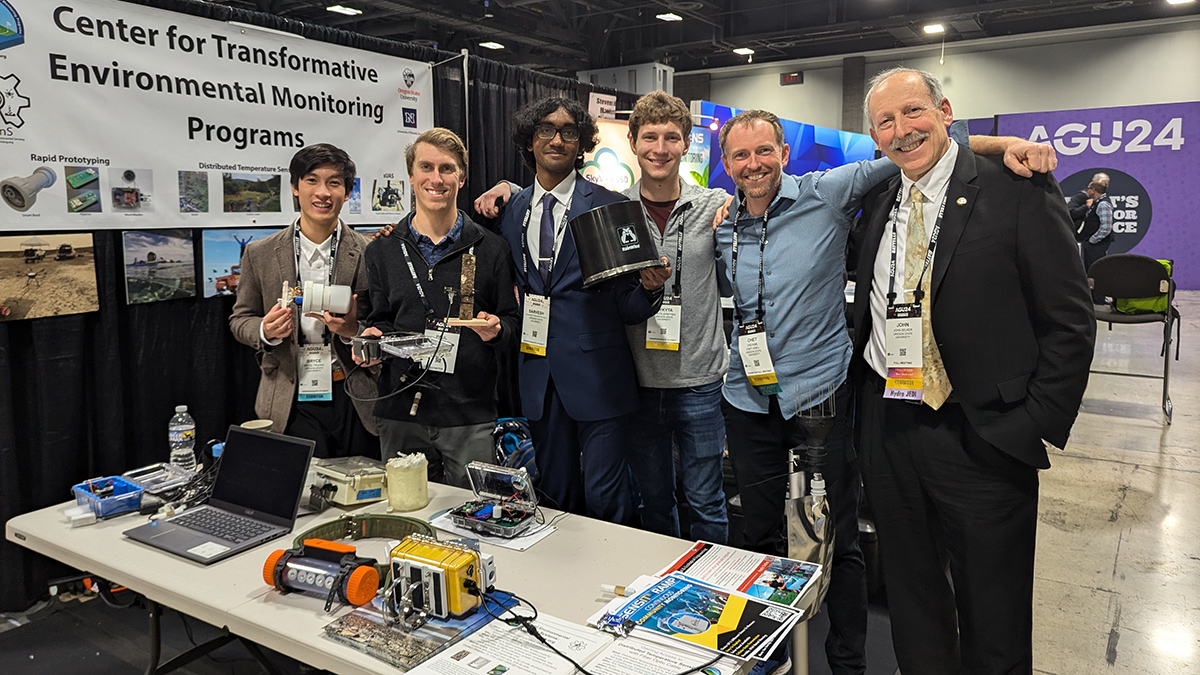
Celebrating the MacGyver Spirit: Hacking, Tinkering, Scavenging, and Crowdsourcing
The MacGyver sessions allow scientist-tinkerers to have “nerd-on-nerd” discussions about do-it-yourself gadgets and gizmos.