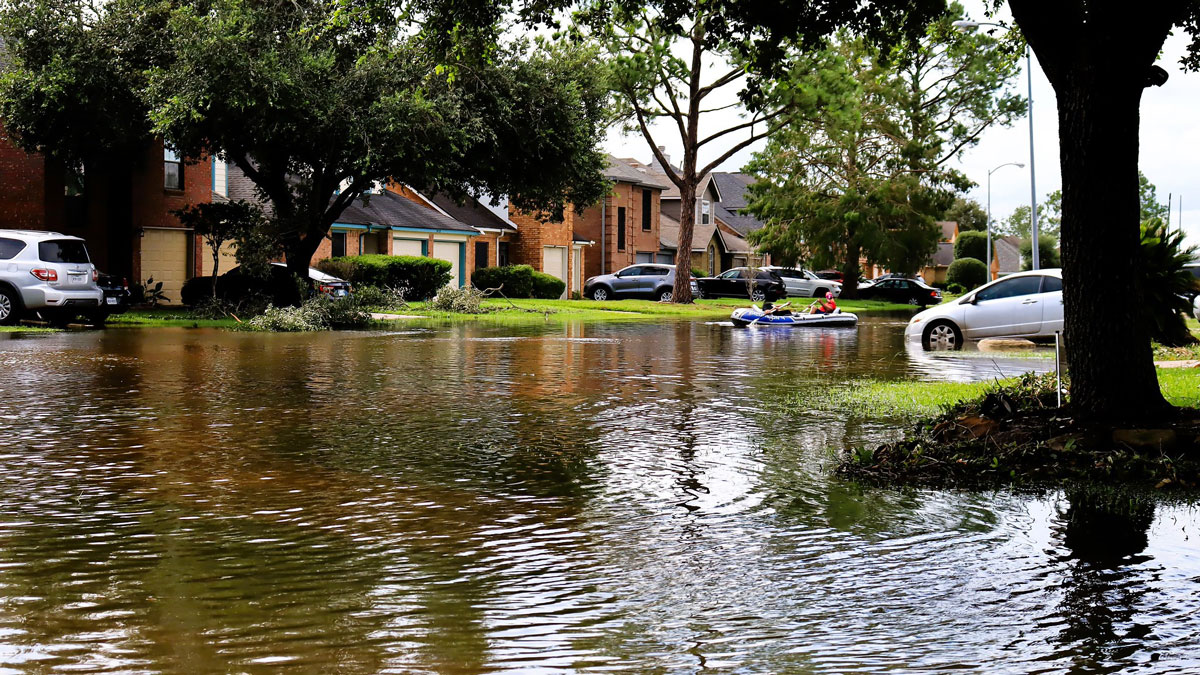
Wetlands protect communities and ecosystems from flooding. A new study quantifies their financial importance.
Rebecca Owen
Posted inResearch Spotlights
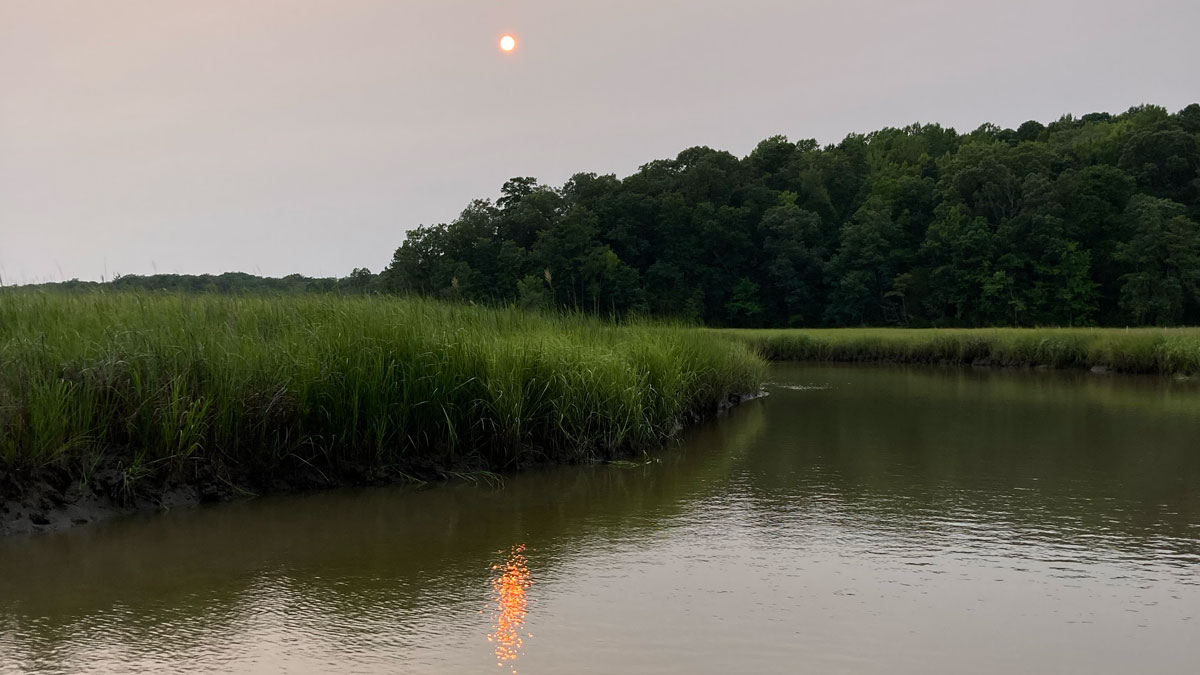
Tracking 20 Years of Productivity in Tidal Wetlands
A new study suggests warming temperatures and increased solar radiation have boosted carbon fixation in tidal wetlands across the country.
Posted inResearch Spotlights
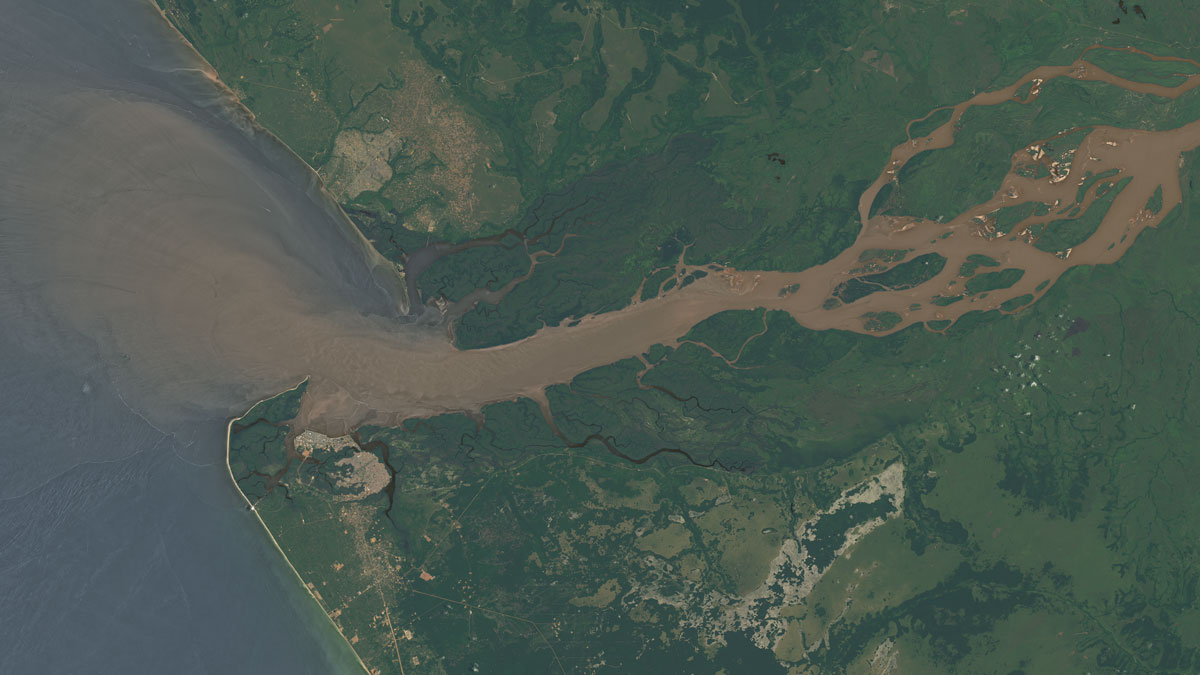
Forty Thousand Cubic Meters of Fresh Water Flow from the Congo into the Atlantic Every Second. A New Study Traces Where It Goes from There.
Researchers combined observations and modeling to track the movement of the Congo’s freshwater plume, noting that eddies play a significant role in the water’s transport.
Posted inNews
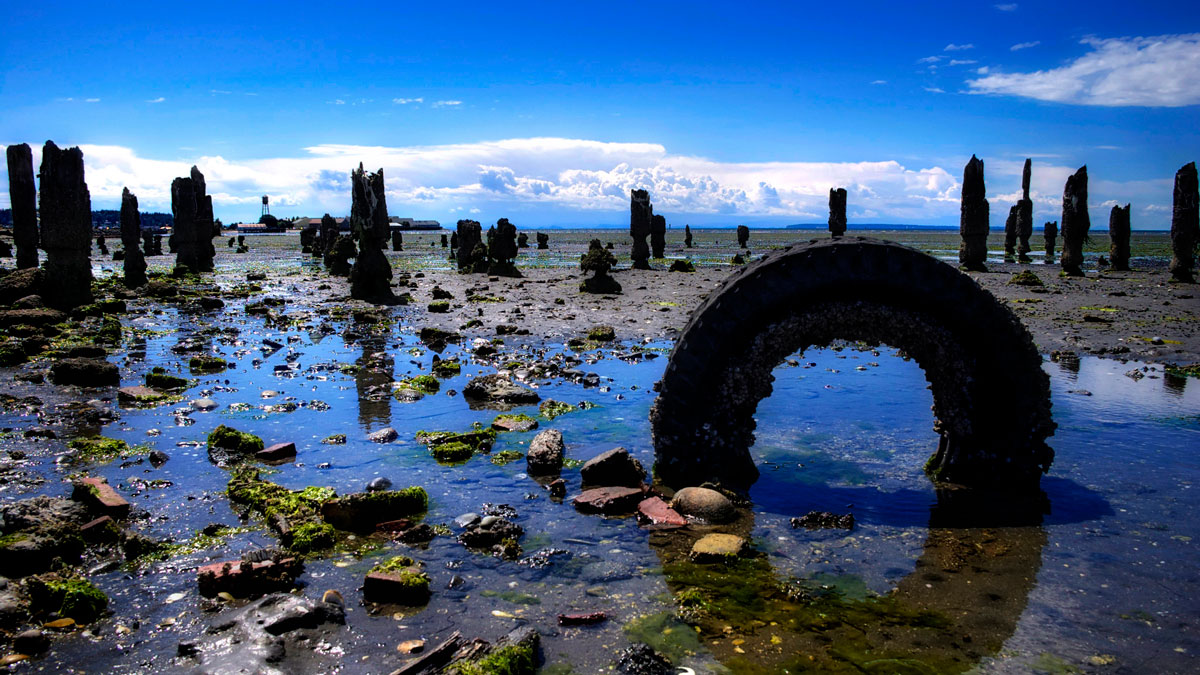
What Tires Leave Behind Can Become Toxic Fish Food
Tire particles might seem tasty, if you’re a fish—but a new study shows how this pervasive microplastic can affect growth and behavior in marine species.
Posted inResearch Spotlights
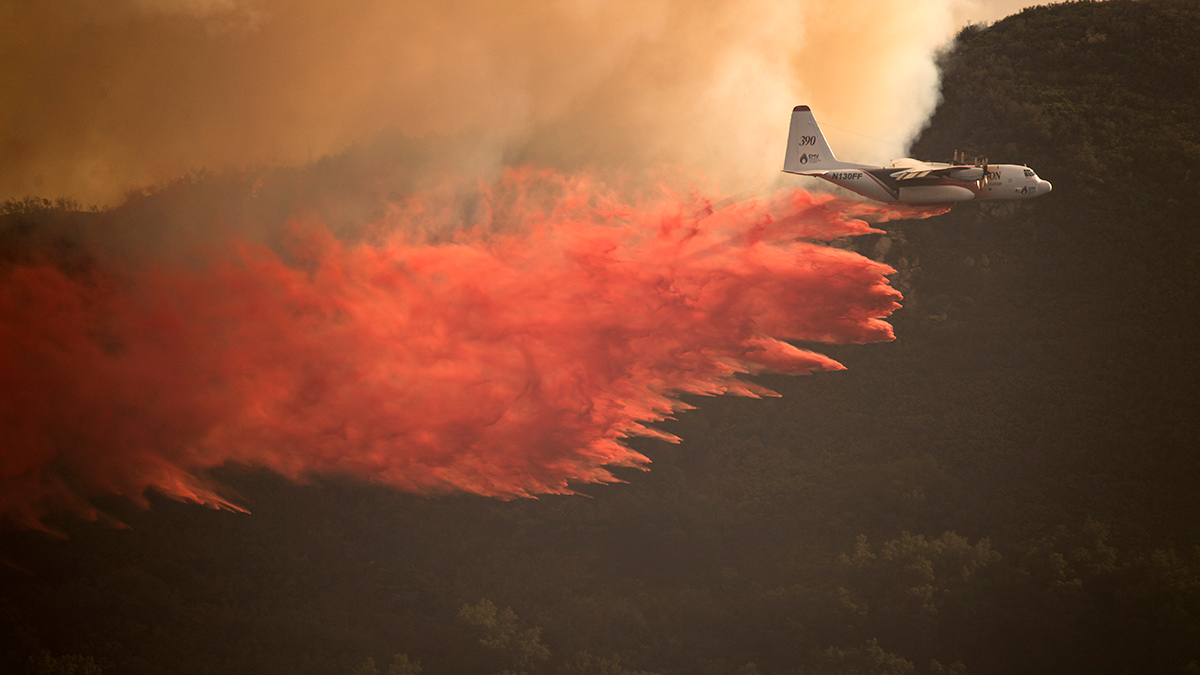
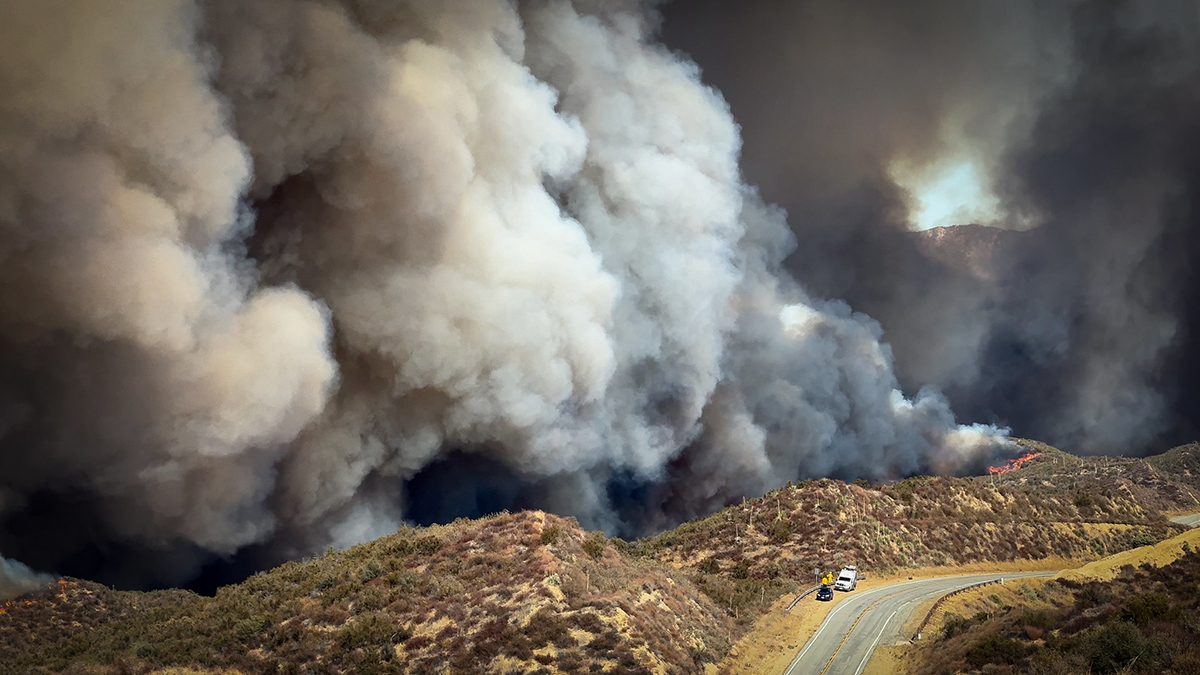
As Wildfires Increase in the West, So Does Suppression Spending
A new study projects the intertwined relationship between fires and the money spent fighting them.
Posted inResearch Spotlights
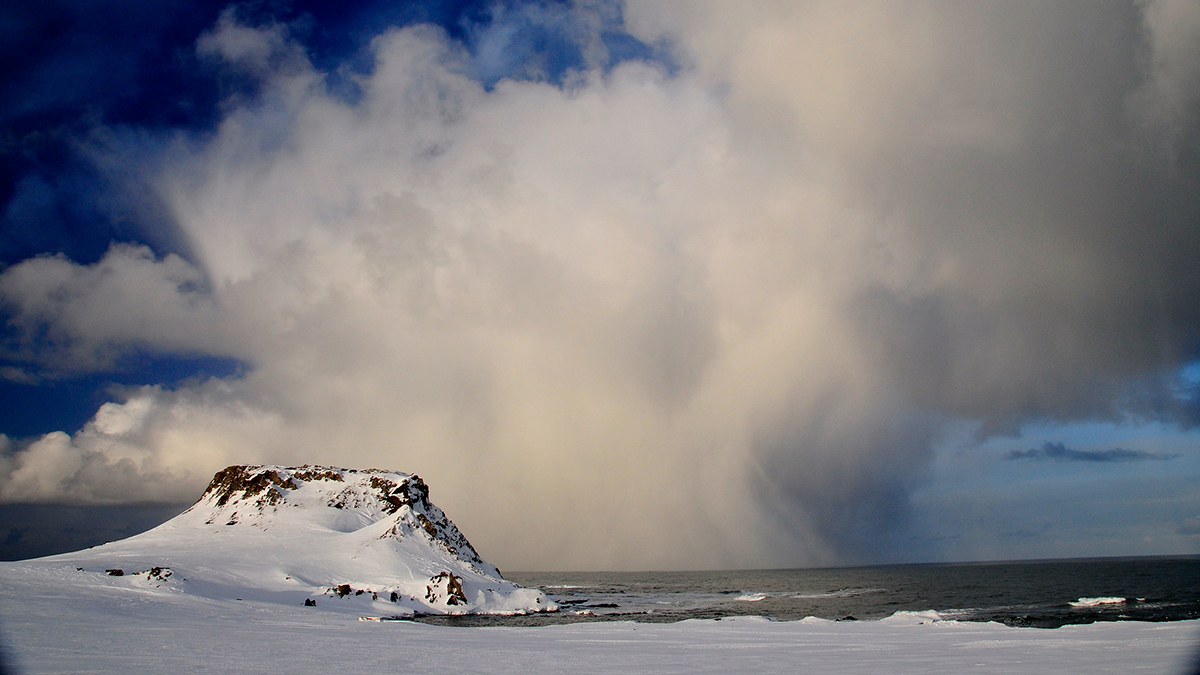
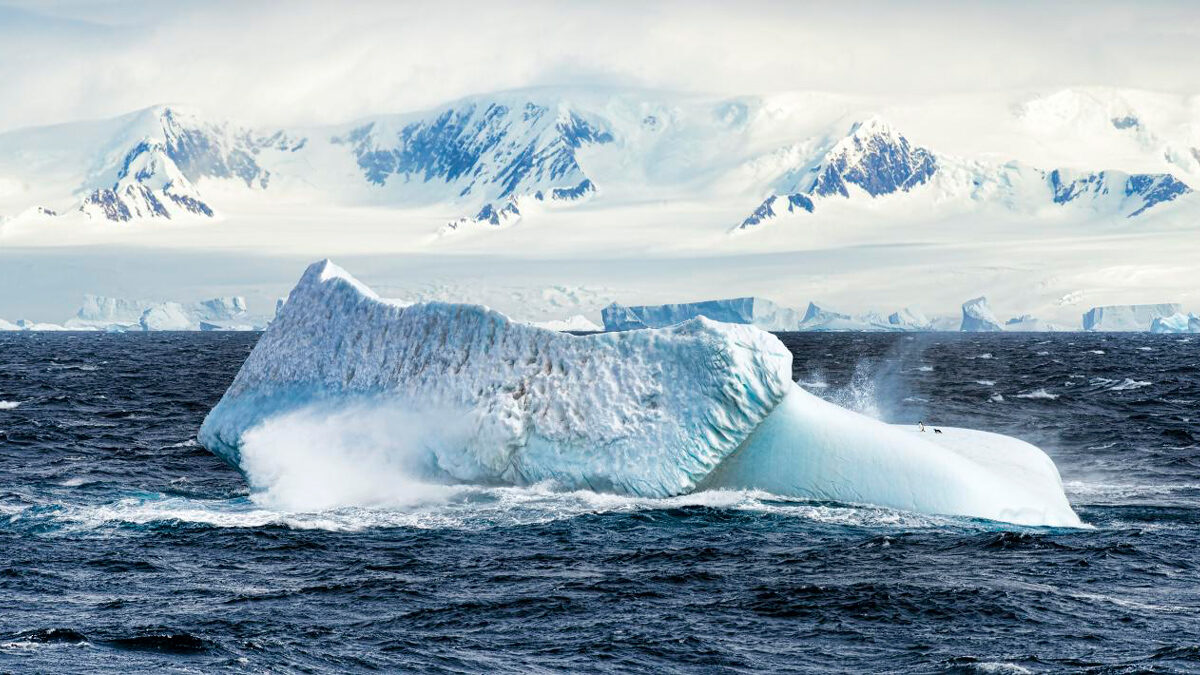
Rivers in the Antarctic Sky, Captured in 3D
A new study shows that atmospheric rivers may be responsible for up to 90% of Antarctica’s annual precipitation.
Posted inResearch Spotlights
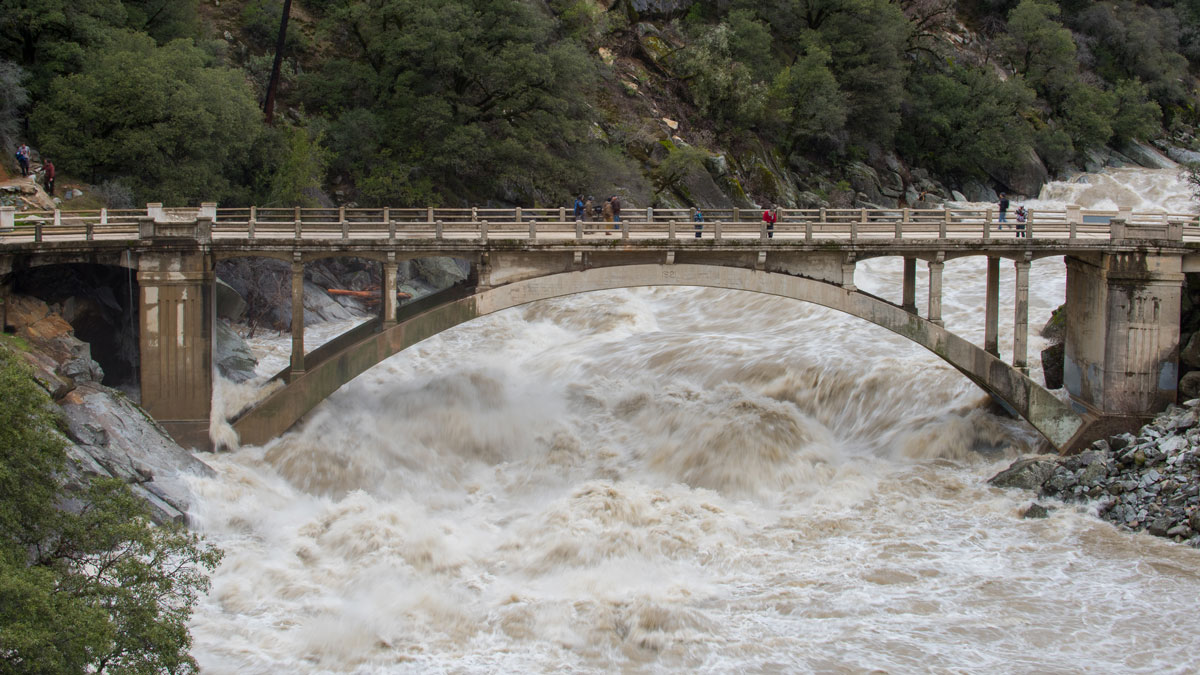
Keeping Humans in the Loop Improves Flood Forecasting
Artificial intelligence and machine learning can improve flood predictions—but human expertise still matters for accurate warnings, new research says.
Posted inResearch Spotlights
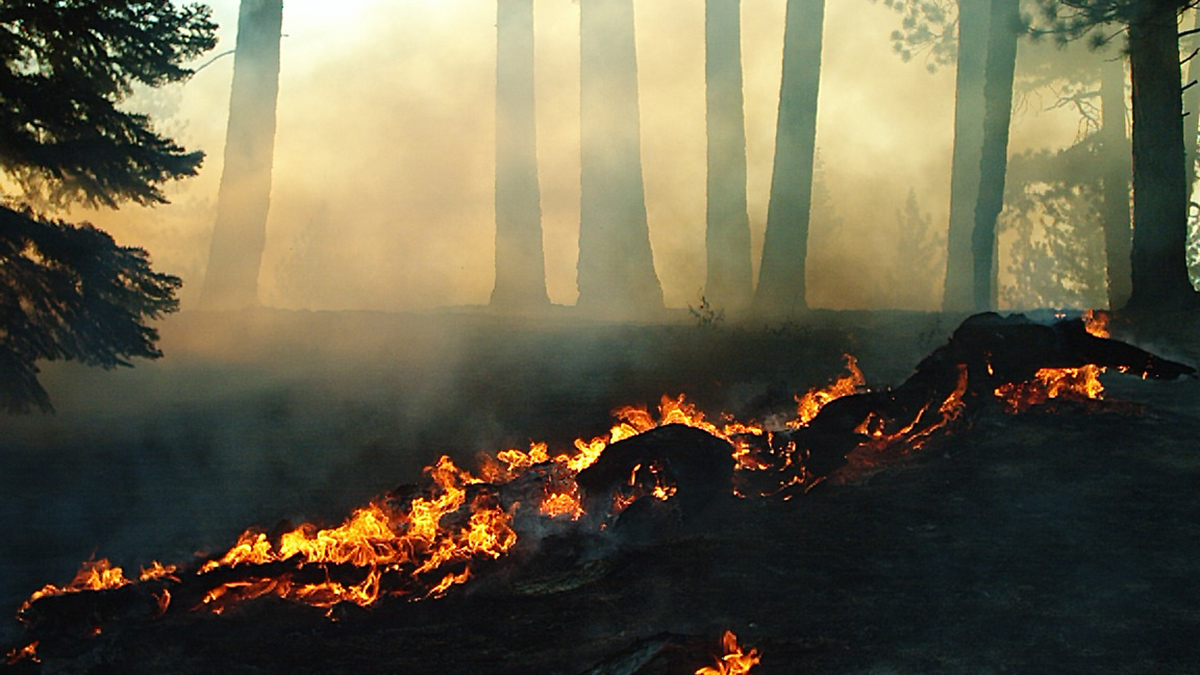
How Much Will Western Wildfires Worsen Under Warming?
A new study reevaluates the use of vapor pressure deficit, or VPD, in climate models to predict increases in area burned by wildfire across the U.S. West.
Posted inResearch Spotlights
Want to Predict Wildfire Severity? Look to the State of Vegetation
A new study connects satellite data on vegetation condition, topography, and weather conditions to examine the predicted versus actual burn severity of the 2025 Los Angeles wildfires.
Posted inNews
Tracing the Path of PFAS Across Antarctica
A new study examines the presence of forever chemicals in one of Earth’s most remote regions.