• About
  • Sections
  • Topics
    • Climate
    • Earth Science
    • Oceans
    • Space & Planets
    • Health & Ecosystems
    • Culture & Policy
    • Education & Careers
    • Opinions
  • Projects
    • Postcards From the Field
    • ENGAGE
    • Editors’ Highlights
    • Editors’ Vox
    • Eos en Español
    • Eos 简体中文版
    • Print Archive: 2015–2025
  • Science Policy Tracker
  • Blogs
    • Research & Developments
    • The Landslide Blog
  • Newsletter
  • Submit to Eos
  • AGU.org
  • Career Center
  • Join AGU
  • Give to AGU
  • About
  • Sections
  • Topics
    • Climate
    • Earth Science
    • Oceans
    • Space & Planets
    • Health & Ecosystems
    • Culture & Policy
    • Education & Careers
    • Opinions
  • Projects
    • Postcards From the Field
    • ENGAGE
    • Editors’ Highlights
    • Editors’ Vox
    • Eos en Español
    • Eos 简体中文版
    • Print Archive: 2015–2025
  • Science Policy Tracker
  • Blogs
    • Research & Developments
    • The Landslide Blog
  • Newsletter
  • Submit to Eos
Skip to content
  • AGU.org
  • Career Center
  • Join AGU
  • Give to AGU
Eos

Eos

Science News by AGU

Support Eos
Sign Up for Newsletter
  • About
  • Sections
  • Topics
    • Climate
    • Earth Science
    • Oceans
    • Space & Planets
    • Health & Ecosystems
    • Culture & Policy
    • Education & Careers
    • Opinions
  • Projects
    • Postcards From the Field
    • ENGAGE
    • Editors’ Highlights
    • Editors’ Vox
    • Eos en Español
    • Eos 简体中文版
    • Print Archive: 2015–2025
  • Science Policy Tracker
  • Blogs
    • Research & Developments
    • The Landslide Blog
  • Newsletter
  • Submit to Eos

Middle East

A flooded urban area is seen from above. Houses and trees are underwater or nearly underwater, and a green landscape emerges from the murky waters in the distance.
Posted inResearch Spotlights

Temperatures Are Rising, but What About Humidity?

by Saima May Sidik 8 January 20268 January 2026

Humid heat extremes are less frequently studied, but no less important, than those of dry heat.

The upper left image shows a clay pot. The lower part of the image is a chart showing age on the x axis and field intensity on the y axis. From about 1050 BCE until 700 BCE, the field intensity is high and has four spikes. After that, it falls until it reaches a low at about 200 CE before rising slightly and falling again at about 1800 CE. The spiky high is circled and labeled “Levantine Iron Age Anomaly” in red. The low from about 1800 to 2000 CE is circled in blue and labeled “Modern field.” A green line of the field intensity of the pot intersects the modern field. In the upper right corner is a large “FAKE” stamp.
Posted inNews

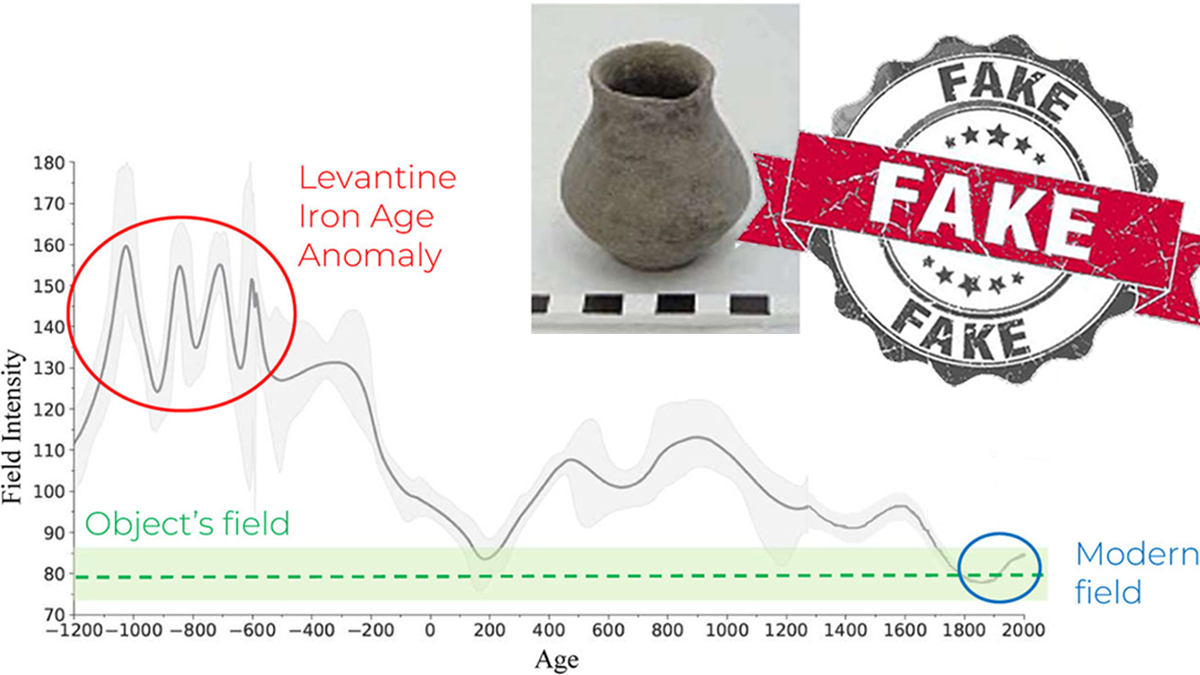
Credible or Counterfeit: How Paleomagnetism Can Help Archaeologists Find Frauds

by Alka Tripathy-Lang 16 December 202516 December 2025

Duplicating artifacts that preserve records from biblical times is a lucrative business. A method used for both dating artifacts and reconstructing Earth’s history could identify phony pieces.

An olive tree is on fire. It stands in front of a low stone wall in a grove of trees.
Posted inNews

98% of Gaza’s Tree Cropland Destroyed by Israel

Kimberly M. S. Cartier, News Writing and Production Intern for Eos.org by Kimberly M. S. Cartier 3 December 20258 January 2026

Maps based on remote sensing analysis could inform remediation efforts by identifying whether agricultural lands were damaged by bombs, debris, or forced displacement of its caretakers.

A satellite image of the Khurais Oil Field in Saudi Arabia taken in February 2017 shows the industrial facility in the desert, releasing two dark black plumes of smoke.
Posted inResearch Spotlights

The Middle East’s First Comprehensive Carbon Budget

Aaron Sidder, freelance science writer by Aaron Sidder 13 March 202513 March 2025

The first greenhouse gas budget for Central and West Asia—24 countries, including Yemen, Türkiye, Kazakhstan, and Afghanistan—was just published.

A partially missing stone archway is flanked by stone lionlike statues
Posted inNews

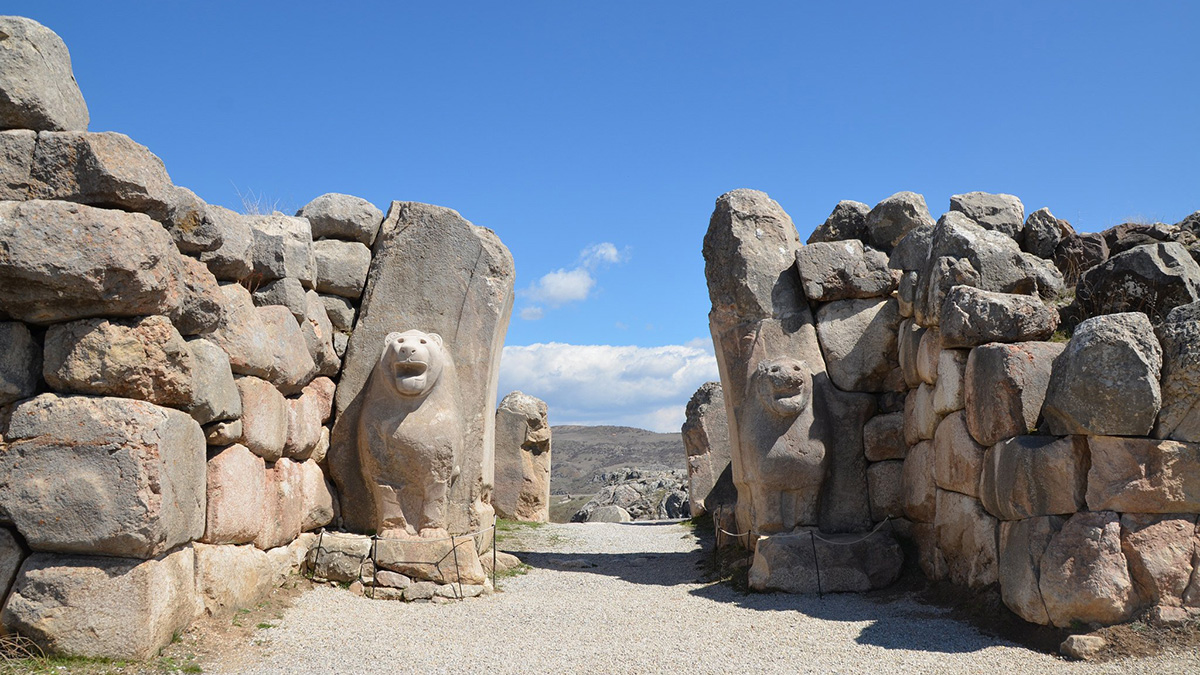
Tree Rings Hint at the Fall of the Hittite Empire

by Humberto Basilio 4 May 202319 May 2023

The Bronze Age civilization adapted to changes in climate but suffered during a prolonged crisis.

Satellite view of parts of the eastern Mediterranean and Middle East showing dust in the atmosphere
Posted inResearch Spotlights

Bacteria Travel Thousands of Kilometers on Airborne Dust

by Derek Smith 22 November 2022

As winds pick up dirt and sand, they also pick up any microbes adhering to those particles, potentially introducing them to new locations.

Map of the Eastern Mediterranean and Middle East with air temperatures shown with color.
Posted inEditors' Vox

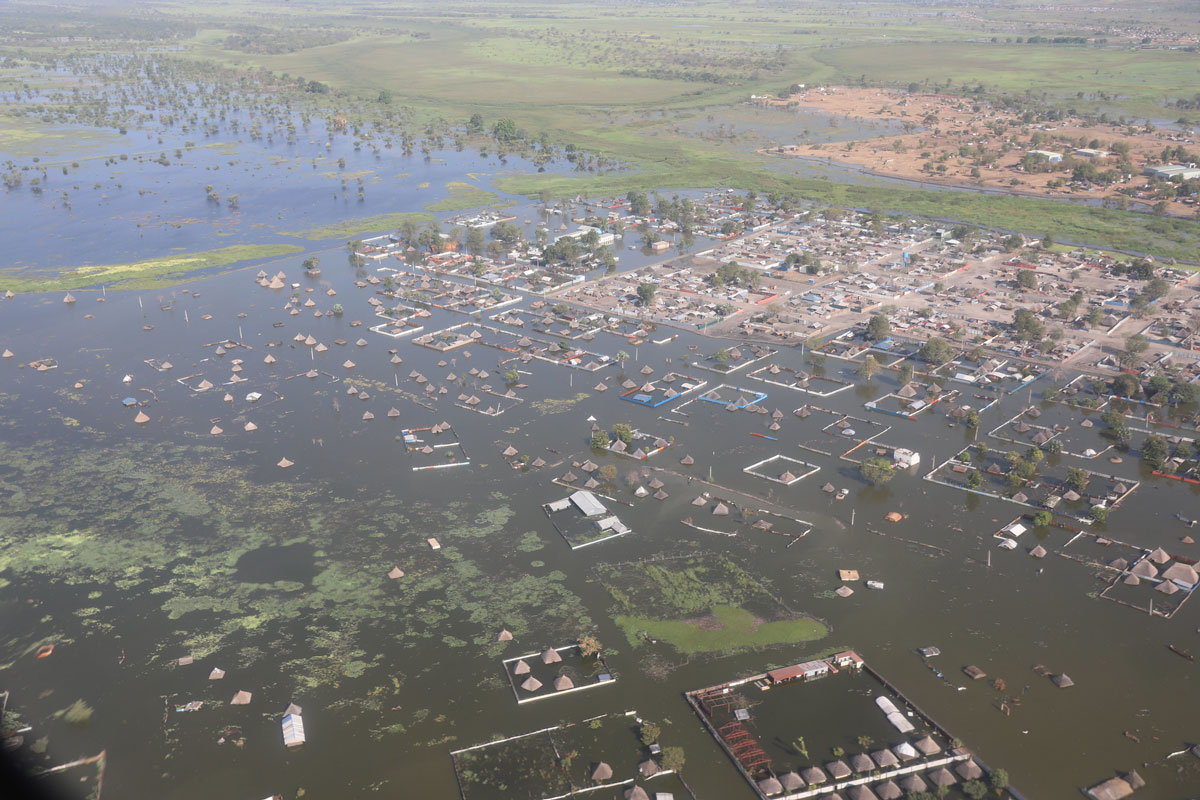
Eastern Mediterranean and Middle East Face Rapid Climate Change

by George Zittis and Jos Lelieveld 25 August 202221 February 2023

Observational and modeling studies identify the Eastern Mediterranean and Middle East as a prominent climate change hotspot associated with weather extremes that have major impacts on society.

A beach at As Sifah, Oman
Posted inResearch Spotlights

Radiometric Dating Sheds Light on Tectonic Debate

Aaron Sidder, freelance science writer by Aaron Sidder 21 January 20222 February 2022

The emplacement of the Samail Ophiolite in Oman has been a source of disagreement among geologists. New state-of-the-art research offers a fresh perspective on its timing and geometry.

A series of panels showing the substantial number of new quality data published for the three geomagnetic elements, declination (left), inclination (center), and intensity (right) with geographical distribution on the top row and temporal distribution on the bottom row.
Posted inEditors' Highlights

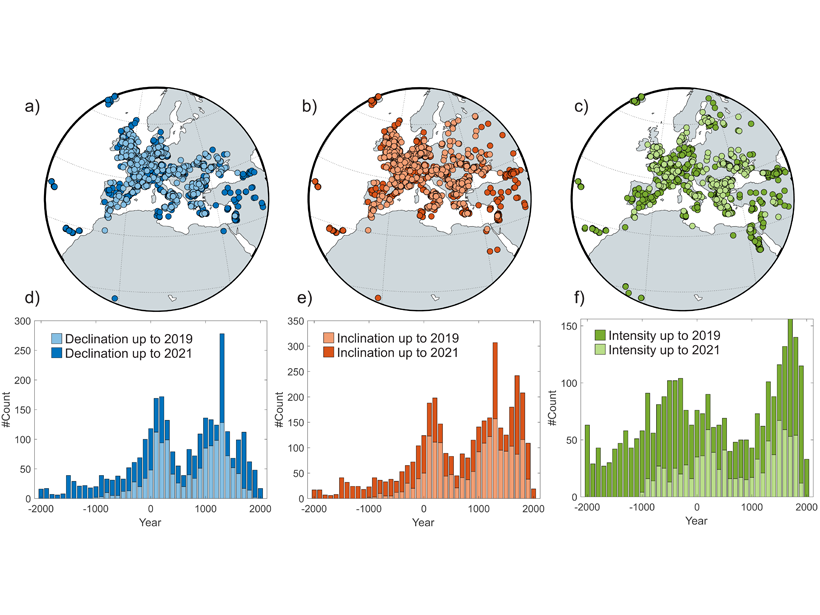
New Spherical Cap Field Model for Europe and Direct Environs

by Mark J. Dekkers 14 May 202121 July 2022

New data on ancient burnt structures is integrated into a superior spherical cap field model for Europe.

Researchers examine large-scale meteorological processes behind extreme precipitation events in the Middle East
Posted inResearch Spotlights

What Causes Flash Floods in the Middle East?

Kate Wheeling, freelance science writer by Kate Wheeling 26 March 201824 October 2022

Researchers zero in on the large-scale meteorological processes driving extreme precipitation events in the hot, arid desert region.

Posts pagination

1 2 Older posts
A view of a bridge, with the New Orleans skyline visible in the distance between the bridge and the water. A purple tint, a teal curved line representing a river, and the text “#AGU25 coverage from Eos” overlie the photo.

Features from AGU Publications

Research Spotlights

New River Chemistry Insights May Boost Coastal Ocean Modeling

9 January 20269 January 2026
Editors' Highlights

Central China Water Towers Provide Stable Water Resources Under Change

9 January 20269 January 2026
Editors' Vox

Hydrothermal Circulation and Its Impact on the Earth System

3 December 20253 December 2025
Eos logo at left; AGU logo at right

About Eos
ENGAGE
Awards
Contact

Advertise
Submit
Career Center
Sitemap

© 2026 American Geophysical Union. All rights reserved Powered by Newspack