• About
  • Special Reports
  • Topics
    • Climate
    • Earth Science
    • Oceans
    • Space & Planets
    • Health & Ecosystems
    • Culture & Policy
    • Education & Careers
    • Opinions
  • Projects
    • Postcards From the Field
    • ENGAGE
    • Editors’ Highlights
    • Editors’ Vox
    • Eos en Español
    • Eos 简体中文版
    • Print Archive: 2015–2025
  • Policy Tracker
  • Blogs
    • Research & Developments
    • The Landslide Blog
  • Newsletter
  • Submit to Eos
  • AGU.org
  • Career Center
  • Join AGU
  • Give to AGU
  • About
  • Special Reports
  • Topics
    • Climate
    • Earth Science
    • Oceans
    • Space & Planets
    • Health & Ecosystems
    • Culture & Policy
    • Education & Careers
    • Opinions
  • Projects
    • Postcards From the Field
    • ENGAGE
    • Editors’ Highlights
    • Editors’ Vox
    • Eos en Español
    • Eos 简体中文版
    • Print Archive: 2015–2025
  • Policy Tracker
  • Blogs
    • Research & Developments
    • The Landslide Blog
  • Newsletter
  • Submit to Eos
Skip to content
  • AGU.org
  • Career Center
  • Join AGU
  • Give to AGU
Eos

Eos

Science News by AGU

Support Eos
Sign Up for Newsletter
  • About
  • Special Reports
  • Topics
    • Climate
    • Earth Science
    • Oceans
    • Space & Planets
    • Health & Ecosystems
    • Culture & Policy
    • Education & Careers
    • Opinions
  • Projects
    • Postcards From the Field
    • ENGAGE
    • Editors’ Highlights
    • Editors’ Vox
    • Eos en Español
    • Eos 简体中文版
    • Print Archive: 2015–2025
  • Policy Tracker
  • Blogs
    • Research & Developments
    • The Landslide Blog
  • Newsletter
  • Submit to Eos

Superfund

A geographic information system (GIS) map shows a number of different layers: Blue areas represent flood zones or floodways, whereas white areas are those with minimal flood hazard. Red, orange, green, and gray areas represent mining waste.
Posted inResearch Spotlights

Making a Map to Make a Difference

by Rebecca Owen 11 February 202611 February 2026

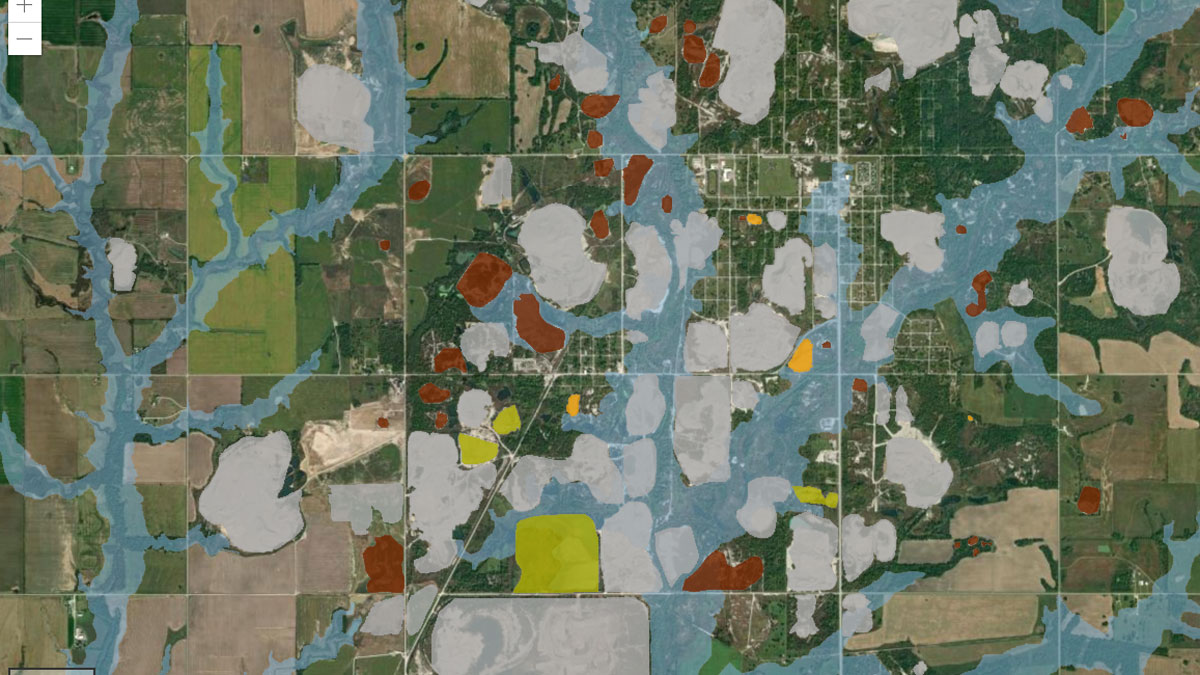
A new study highlights the partnership between scientists and nonscientist community members in building an interactive GIS map to show flooding risk in a Superfund site.

A chat, or waste, pile near the Tar Creek Superfund site in Oklahoma.
Posted inNews

Community Input Drives Superfund Research

by Robin Donovan 14 December 202125 October 2022

Researchers identified geochemical tracers for lead and investigated Oklahomans’ concerns at the Tar Creek Superfund site.

Dam failure in Iowa
Posted inNews

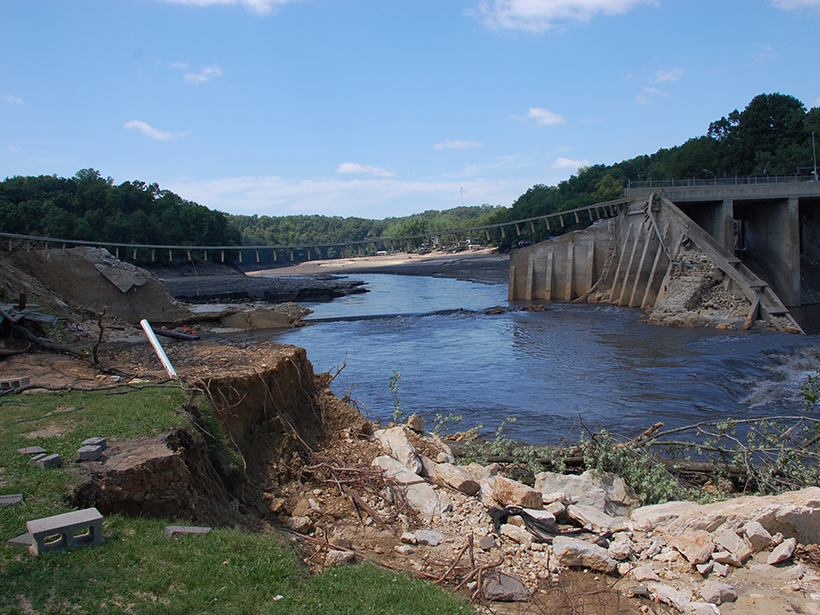
Below Aging U.S. Dams, a Potential Toxic Calamity

by J. Dinneen and A. Kennedy 11 June 20216 January 2023

Documents suggest that in more than 80 U.S. locations, the failure of an aging dam could flood a major toxic waste site.

Over a dark blue-green square appear the words Special Report: The State of the Science 1 Year On.

Features from AGU Publications

Research Spotlights

Stealth Superstorms Reveal Lightning on Jupiter: Beyond the Superbolt

23 March 202623 March 2026
Editors' Highlights

Trees Shed Their Leaves to Adapt to Droughts

20 March 202620 March 2026
Editors' Vox

The Future of Earth’s Future

24 March 202624 March 2026
Eos logo at left; AGU logo at right

About Eos
ENGAGE
Awards
Contact

Advertise
Submit
Career Center
Sitemap

© 2026 American Geophysical Union. All rights reserved Powered by Newspack