• About
  • Special Reports
  • Topics
    • Climate
    • Earth Science
    • Oceans
    • Space & Planets
    • Health & Ecosystems
    • Culture & Policy
    • Education & Careers
    • Opinions
  • Projects
    • Postcards From the Field
    • ENGAGE
    • Editors’ Highlights
    • Editors’ Vox
    • Eos en Español
    • Eos 简体中文版
    • Print Archive: 2015–2025
  • Policy Tracker
  • Blogs
    • Research & Developments
    • The Landslide Blog
  • Newsletter
  • Submit to Eos
  • AGU.org
  • Career Center
  • Join AGU
  • Give to AGU
  • About
  • Special Reports
  • Topics
    • Climate
    • Earth Science
    • Oceans
    • Space & Planets
    • Health & Ecosystems
    • Culture & Policy
    • Education & Careers
    • Opinions
  • Projects
    • Postcards From the Field
    • ENGAGE
    • Editors’ Highlights
    • Editors’ Vox
    • Eos en Español
    • Eos 简体中文版
    • Print Archive: 2015–2025
  • Policy Tracker
  • Blogs
    • Research & Developments
    • The Landslide Blog
  • Newsletter
  • Submit to Eos
Skip to content
  • AGU.org
  • Career Center
  • Join AGU
  • Give to AGU
Eos

Eos

Science News by AGU

Support Eos
Sign Up for Newsletter
  • About
  • Special Reports
  • Topics
    • Climate
    • Earth Science
    • Oceans
    • Space & Planets
    • Health & Ecosystems
    • Culture & Policy
    • Education & Careers
    • Opinions
  • Projects
    • Postcards From the Field
    • ENGAGE
    • Editors’ Highlights
    • Editors’ Vox
    • Eos en Español
    • Eos 简体中文版
    • Print Archive: 2015–2025
  • Policy Tracker
  • Blogs
    • Research & Developments
    • The Landslide Blog
  • Newsletter
  • Submit to Eos

Thriving Earth Exchange

A geographic information system (GIS) map shows a number of different layers: Blue areas represent flood zones or floodways, whereas white areas are those with minimal flood hazard. Red, orange, green, and gray areas represent mining waste.
Posted inResearch Spotlights

Making a Map to Make a Difference

by Rebecca Owen 11 February 202611 February 2026

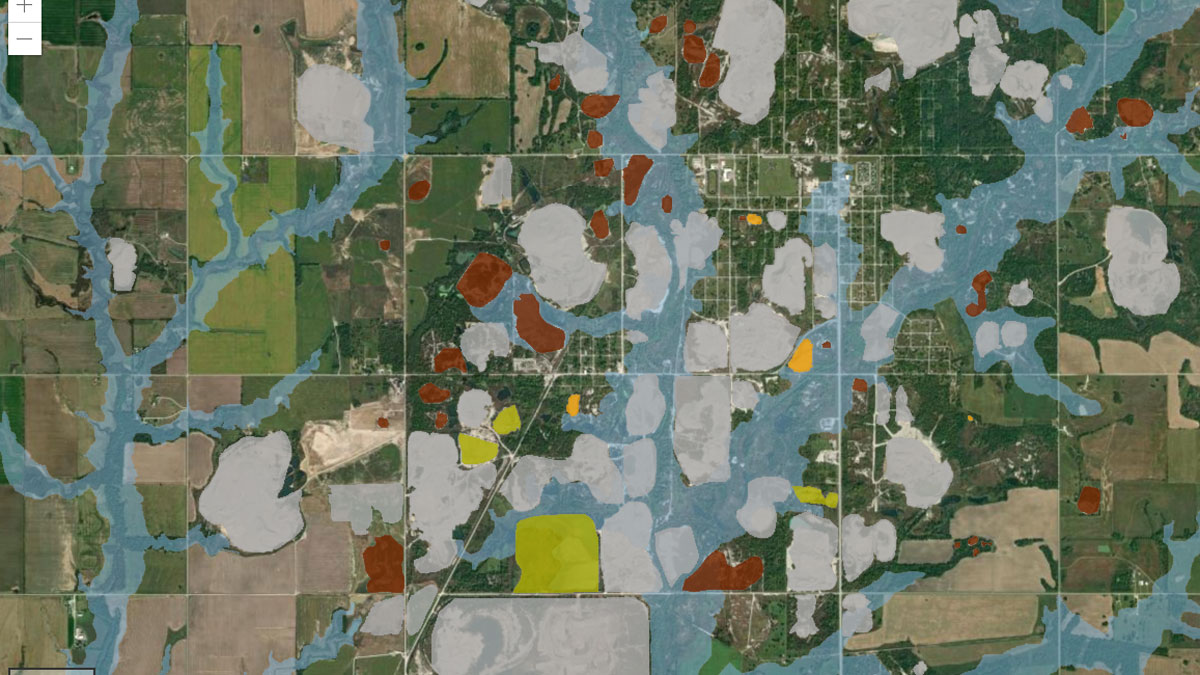
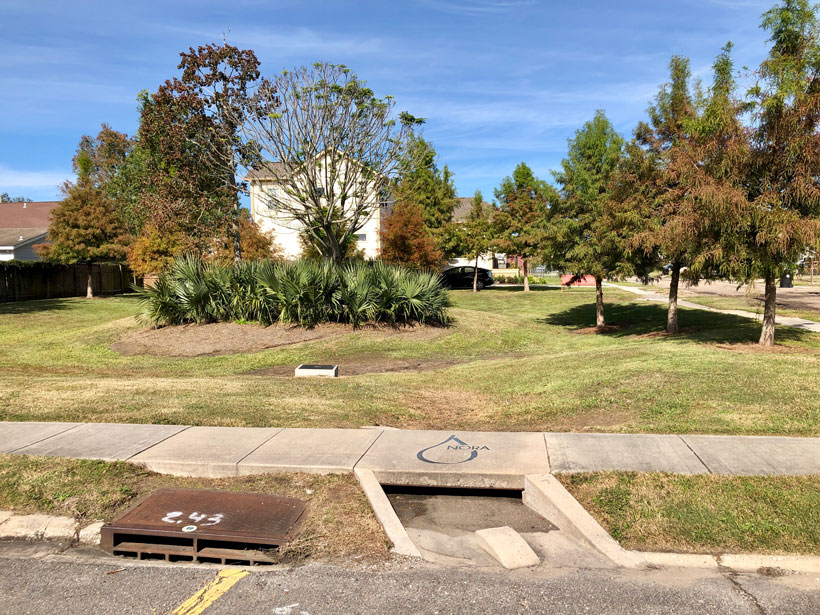
A new study highlights the partnership between scientists and nonscientist community members in building an interactive GIS map to show flooding risk in a Superfund site.

Aerial view of downtown Lincoln, Neb.
Posted inNews

Geoscientists Help Map the Pandemic

Sarah Derouin, Science Writer by Sarah Derouin 1 May 202023 January 2023

Data visualization and mapping are valuable tools in the fight against COVID-19. Geoscientists can help healthcare workers and shape public policy.

Hilton Kelley of Community In-Power and Development Association
Posted inAGU News

Communities Thrive with Thriving Earth

Korena Di Roma Howley, Science Writer by Korena Di Roma Howley 25 November 201915 October 2021

As AGU celebrates 100 years, its Thriving Earth Exchange is setting a foundation for the future, partnering with community leaders to bring scientific solutions to pressing local issues.

Scientists, community leaders, and Thriving Earth Exchange staff celebrate after a workshop launching new projects
Posted inAGU News

AGU’s Thriving Earth Exchange Wins 2019 Power of A Summit Award

by J. Speiser 10 July 20194 April 2023

The highest honor of the American Society of Association Executives recognizes organizations that benefit the United States and the world.

A sunset over Missoula, Montana.
Posted inAGU News

Mapping Heat Vulnerability to Protect Community Health

by K. McCarthy and Z. Valdez 5 April 201915 February 2023

Community leaders and scientists from two U.S. cities are combining public health data and heat maps to prepare residents for climate change–related health risks.

A New Orleans rain garden provides an innovative approach to water management
Posted inAGU News

Community-Driven Science: Update on the Thriving Earth Exchange

by Raj Pandya 7 December 201819 October 2021

As AGU marks its Centennial, our organization’s program that recruits volunteer scientists to help with local priorities celebrates 5 years of working in communities representing 12 million people.

Block party in New Orleans highlight results from a citizen science flood monitoring project.
Posted inAGU News

AGU-Led National Study: Citizen Science Can Aid Science Learning

by P. L. Weiss 1 November 20187 April 2023

Improved design of citizen science projects in which nonscientists and scientists collaborate can boost the amount of science learning by nonscientists and communities.

Damage that occurred after Hurricane Sandy in 2012.
Posted inAGU News

Communities and Experts Collaborate for Climate Resilience

by N. D. Lamontagne 11 July 20171 March 2023

The Resilience Dialogues program provides resources and expertise to help communities build individualized plans for resilience in the face of climate change.

New York’s High Line
Posted inAGU News

AGU's Thriving Earth Exchange Links Science with Small Towns

by P. Dumont 8 December 201626 March 2024

Scientists and students collaborate with communities to create a greener municipal building in Midway, Ga., and assess residents' vulnerability to warming climate in Brookline, Mass.

Ulaanbaatar Mongolia air pollution
Posted inAGU News

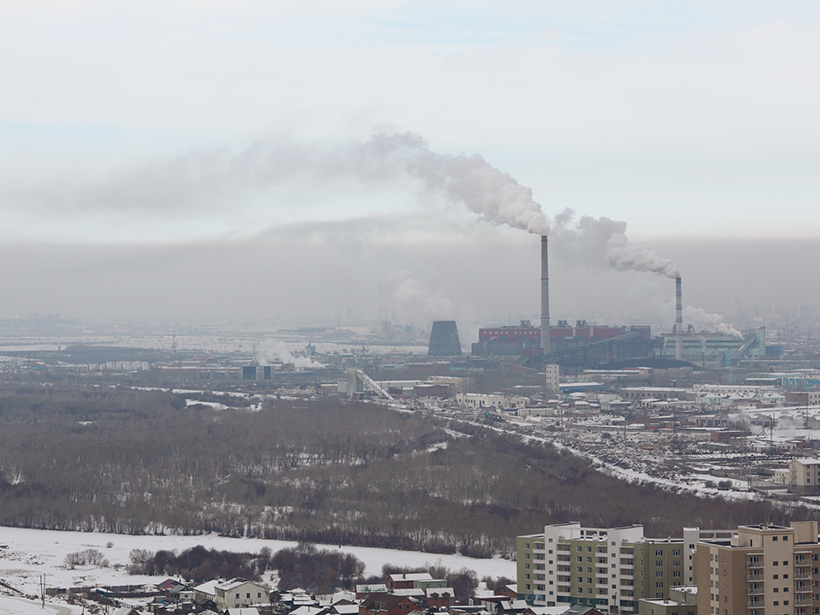
Closing the Air Quality Data Gap in the Developing World

by K. Pierce 11 July 20169 December 2022

How a husband-and-wife team created the world's first open access, open source international air quality data hub—a global resource for health organizations, policy makers, and others.

Posts pagination

1 2 Older posts
Over a dark blue-green square appear the words Special Report: The State of the Science 1 Year On.

Features from AGU Publications

Research Spotlights

Drought Drove the Amazon’s 2023 Switch to a Carbon Source

25 February 202625 February 2026
Editors' Highlights

Satellite View of the California Wildfires of January 2025

27 February 202626 February 2026
Editors' Vox

A Double-Edged Sword: The Global Oxychlorine Cycle on Mars

10 February 202610 February 2026
Eos logo at left; AGU logo at right

About Eos
ENGAGE
Awards
Contact

Advertise
Submit
Career Center
Sitemap

© 2026 American Geophysical Union. All rights reserved Powered by Newspack