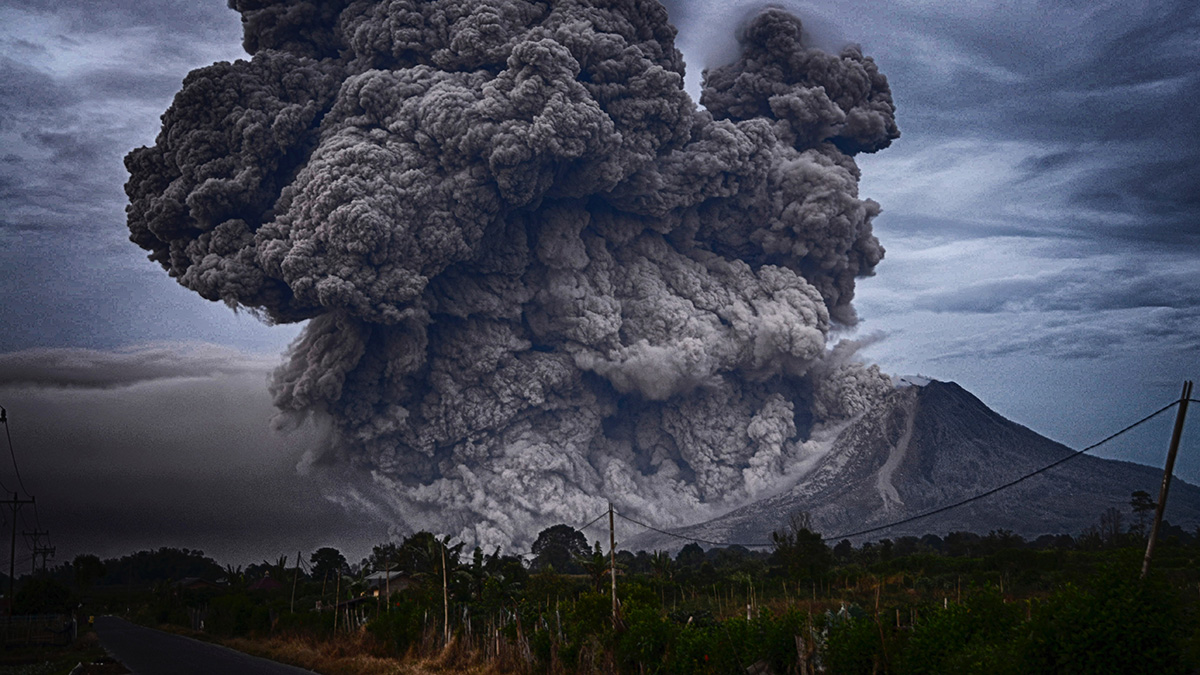
In 1815, an Earth-shattering explosion sent roughly 130 cubic kilometers of gaseous fumes, ash, and rocks high into the atmosphere above the Indonesian island of Sumbawa. Mount Tambora had blown its top. Temperatures tanked worldwide as sooty debris circulated in the skies of the Northern Hemisphere, blocking the Sun’s rays. The chilling effects lasted through 1816—later dubbed the “Year Without a Summer.”
More than 206 years later and more than 16,000 kilometers away from Mount Tambora, geoscientist Alice Bradley and her team of undergraduate researchers at Williams College are studying how Tambora and other major volcanic eruptions affected the climate in New England. Their source material is a weather data set that dates back more than 2 centuries to the Tambora eruption. It has been updated daily by Williams staff and students ever since.

The team’s statistical sleuthing revealed temperature dips in New England following major volcanic events, including three iconic blasts in South Asia: Tambora, Krakatoa in Indonesia in 1883, and Mount Pinatubo in the Philippines in 1991. Bradley presented her group’s work on 12 December at AGU’s Fall Meeting 2022.
“You take climate, and then you throw a big explosion into it, things get exciting quickly,” Bradley said.
Two Centuries of Notes
Early records from the Williams College physical weather archive are contained in a series of books, a collection so large that it’s housed in an off-campus storage facility. The first researchers recorded temperature and precipitation three times daily, a habit established by archive cofounder Chester Dewey in 1816. He took measurements outside his campus home until staff built a dedicated thermometer shelter. Then in 1837, workers began recording the data at Hopkins Observatory—one of the oldest existing astronomical observatories in the United States.
“The number of hands that might have been involved, we have no idea.”
Little is known about the dutiful staff and students who maintained the record throughout the years. Aside from the founders, no one signed their name. “The number of hands that might have been involved, we have no idea,” said Williams archivist Sylvia Kennick Brown. Observers shifted to digital records in the 1970s, and Brown began officially archiving the entire data set in 1988. It’s wonderful and surprising that the continuous record survived, she said. Prior to the official archive program, the observations were being squirreled away in attics and basements.
When Bradley learned of the data set, which is now publicly available through the college’s Geosciences Department, she quickly realized that it coincided with several major volcanic events. With the right methods, they could test how these eruptions affected the weather a world away.
Statistical Sleuthing
Differences in measurement standards and locations and advances in technology over time made it difficult to directly compare archival data across various time frames. Instead, the team identified weather anomalies against “baseline” periods lasting 5 to 10 years prior to or after each eruption.
Then, to test whether these observations matched theoretical predictions, the team compared these anomalies against climate models from the Coupled Model Intercomparison Project Phase 6 (CMIP6) Model Intercomparison Project on the Climatic Response to Volcanic Forcing (VolMIP), which predicts climatic changes that might unfold following a major volcanic eruption.
According to the team’s analysis, daily low temperatures after the Tambora and Pinatubo eruptions were often more than 5°C below baseline.
“It would be among the longest continuous records in the United States.”
These differences exceed VolMIP’s predictions, the researchers found. That means either the models do not capture the full experience of climate in New England or the historic data set needs to be expanded, Bradley said.
There are a number of historical accounts that corroborate the cooling seen in the data set, said Cornell climatologist and Northeast Regional Climate Center director Arthur DeGaetano. DeGaetano, who was not involved in the research, was surprised by the extent of the record. “It would be among the longest continuous records in the United States,” he said.
The team now hopes to secure funding to rebuild the old weather stations in their original locations and equip them with weather instruments resembling those from their original years of operation. This kind of calibration will make the database more useful for historical analysis across decades, Bradley said. And in time, it will contribute to our understanding of the effects of climate-changing events.
Windows to the Past
Today, researchers collect, log, and preserve weather records automatically using a weather station at Hopkins Memorial Forest. Anyone can access the data through the college’s Geosciences Department. Automation saves time and energy, but still, part of the project’s appeal is unearthing the analog impressions recorded by past generations of students and staff, Bradley said.
For instance, during the Year Without a Summer, the average temperature in Williamstown, Mass., was only about 1°C below baseline. But this small shift had significant consequences for residents. Their notations included these entries in 1816:
June 6: “Snowed several times, turned the ground white.”
June 10: “Heavy frost—vegetables killed.”
The archive provides data for scientists to quantify weather anomalies, sure. But for the curious eye, it’s more than that: It’s a log of the human experience.
—Shannon Banks (@SbanksOwl), Science Writer
This news article is included in our ENGAGE resource for educators seeking science news for their classroom lessons. Browse all ENGAGE articles, and share with your fellow educators how you integrated the article into an activity in the comments section below.