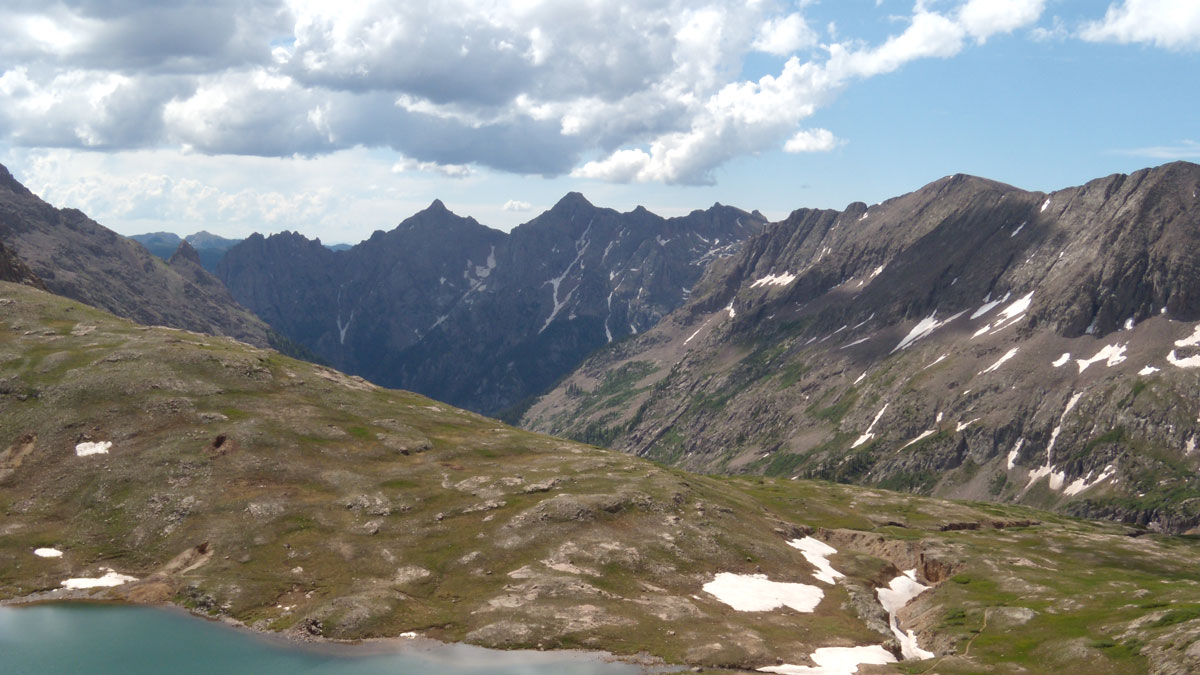
An alpine lake holds traces of how Spanish conquistadors kicked up dust as they colonized the Southwest.
history
Posted inNews
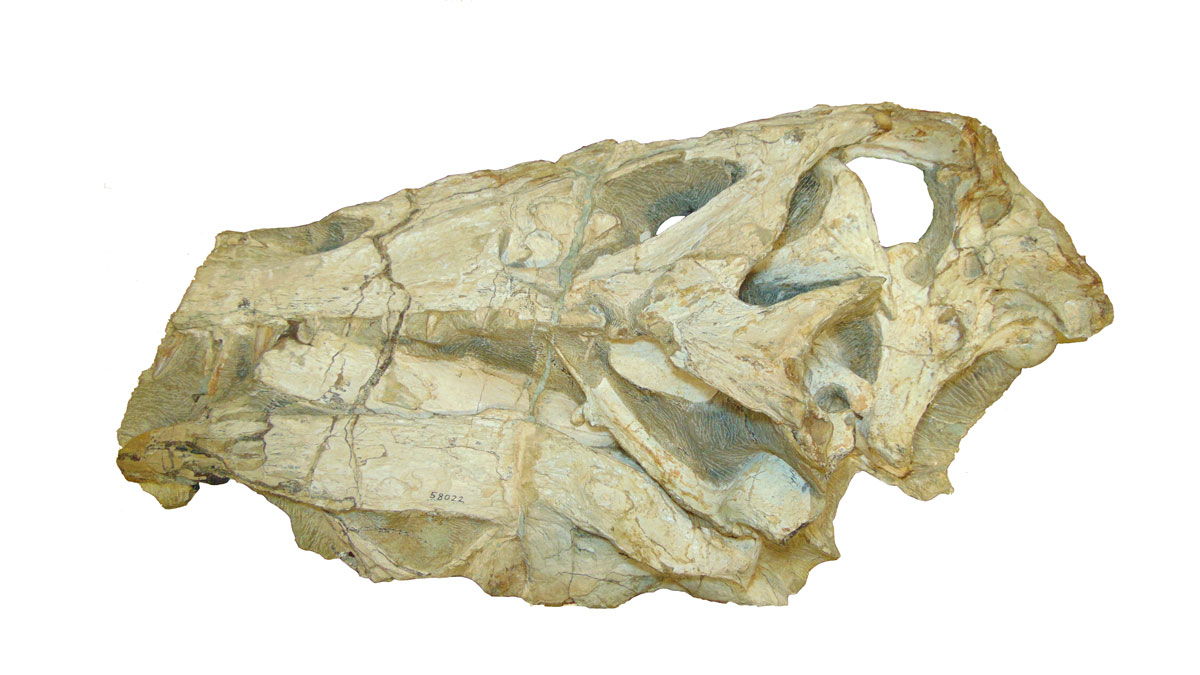
Germany to Return Contested Dinosaur Fossil to Brazil
Following a long restitution campaign, both countries announced their willingness to repatriate the 110-million-year-old spinosaurid Irritator challengeri.
Posted inNews
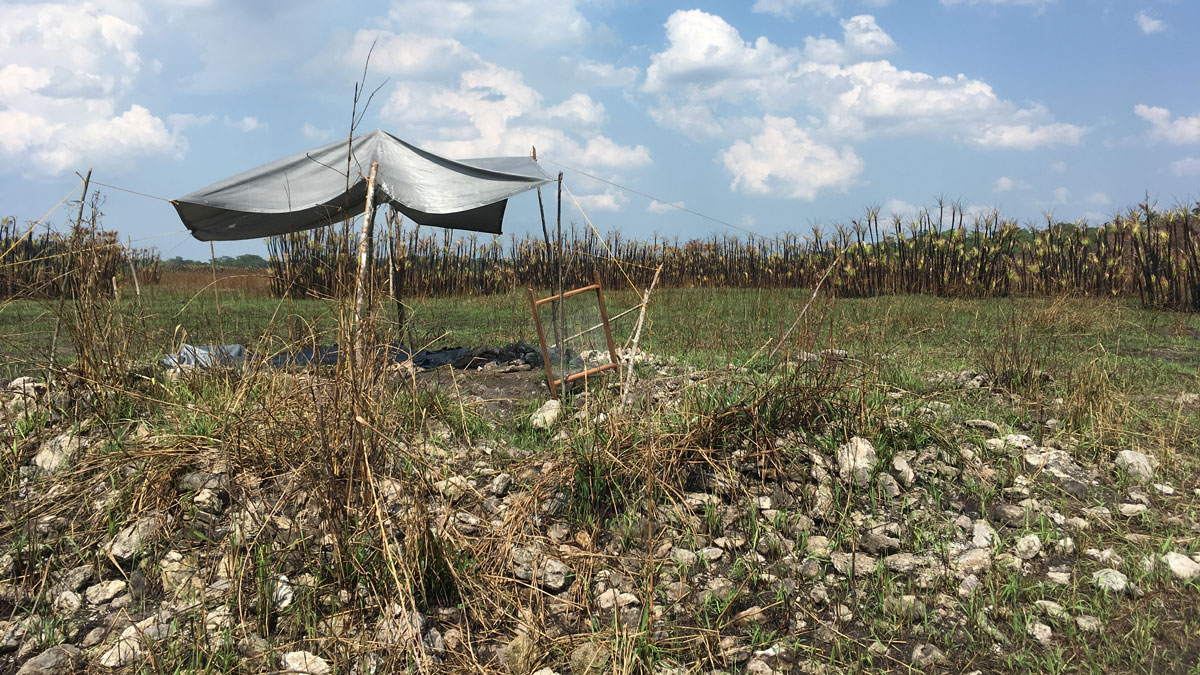
Ancient Maya Wetlands Reveal Settlement That Thrived Amid “Collapse”
A newly excavated site provides evidence that Maya communities migrated from urban areas to rural wetlands during times of intense drought.
Posted inNews
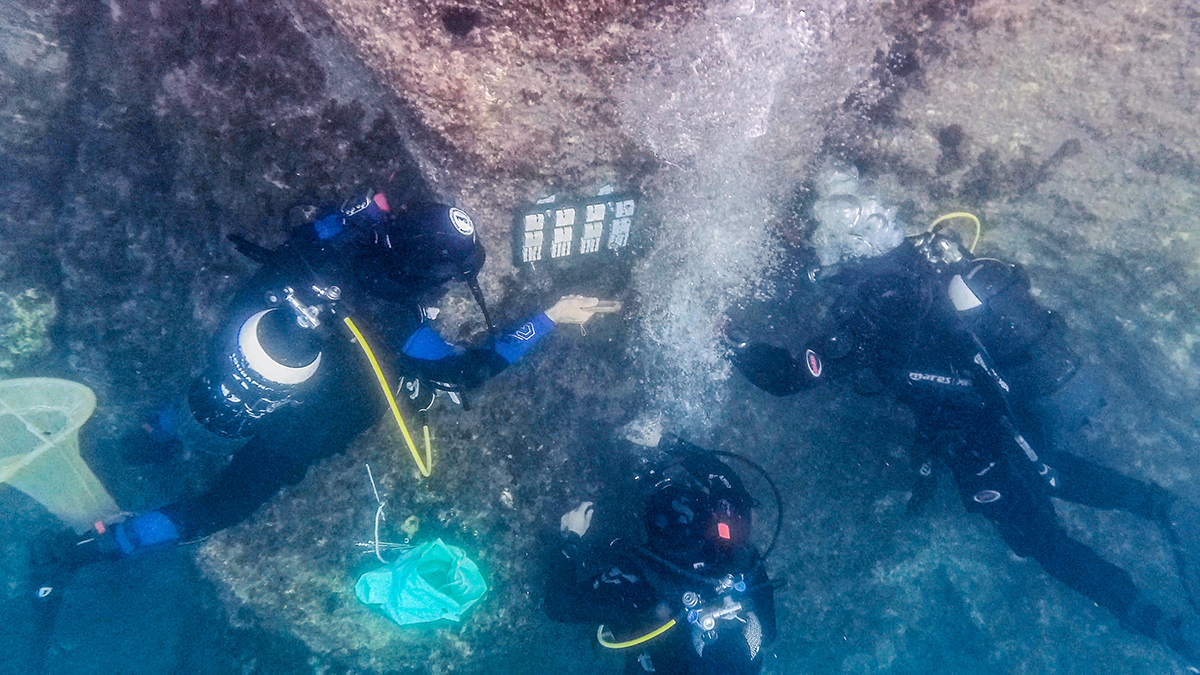
Acidifying Seas Are Wearing Away at Underwater Archaeology
Marble, limestone, and other carbonate rocks used throughout antiquity could start dissolving as oceans soak up more carbon dioxide.

Posted inFeatures
Salt of the Earth: Vast Underground Salt Caverns Are Preserving Our History—and Just Might Power Our Future
From health spas to film storage, salt mine caverns have been put to use in surprising ways—and they’re now poised to contribute to the generation and storage of clean energy.
Posted inResearch Spotlights
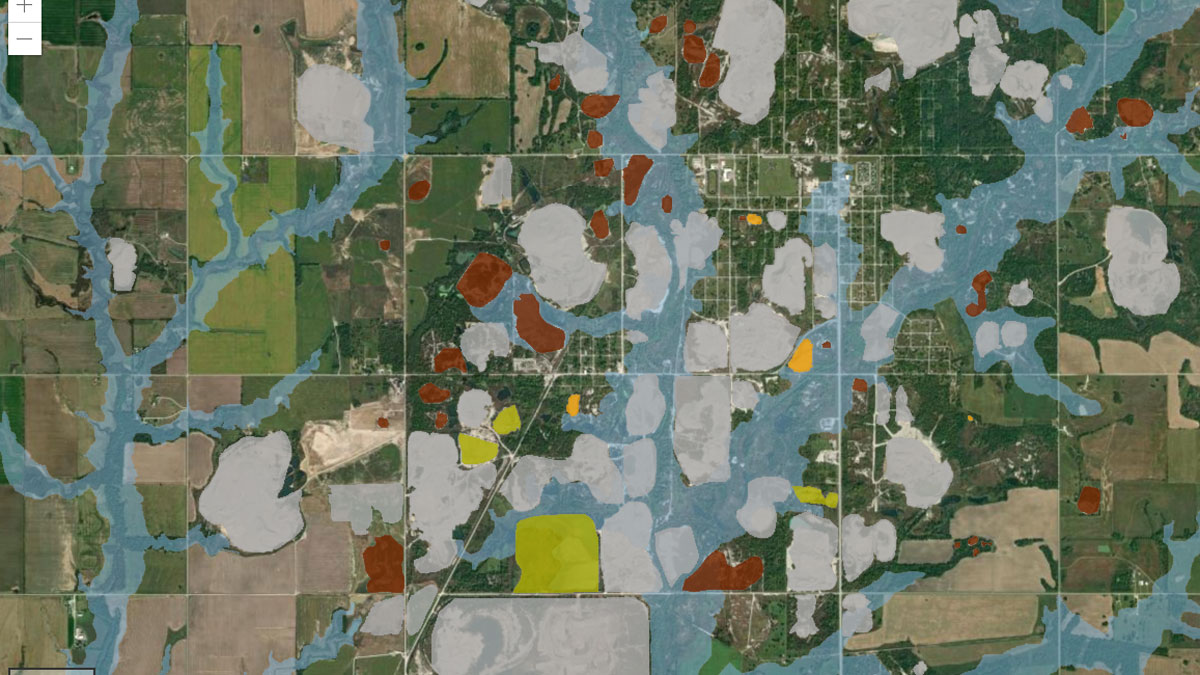
Making a Map to Make a Difference
A new study highlights the partnership between scientists and nonscientist community members in building an interactive GIS map to show flooding risk in a Superfund site.
Posted inNews
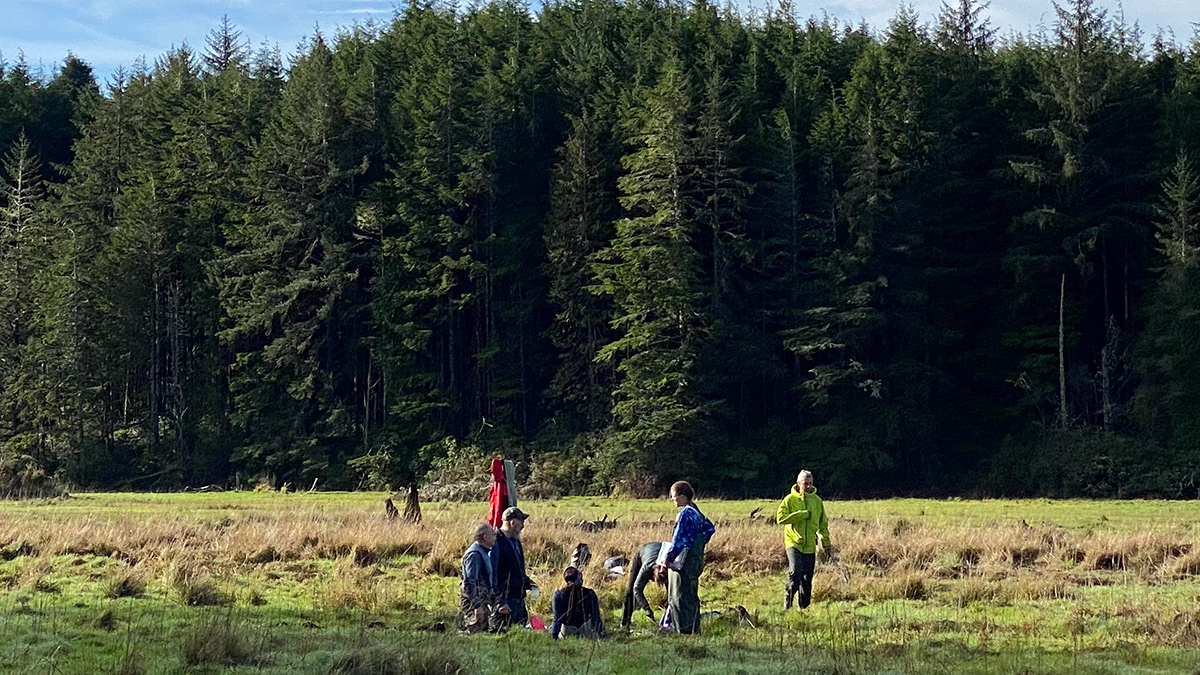
Blending Science and Indigenous Knowledge to Tell an Estuary’s Story
A new study of nutrient levels in soil cores supports oral Indigenous history, informing future estuary restoration efforts.

Posted inNews
What Okinawan Sailor Songs Might Teach Us About the Climate
New work bridges the worlds of Ryukyuan classical music and the geosciences.
Posted inNews
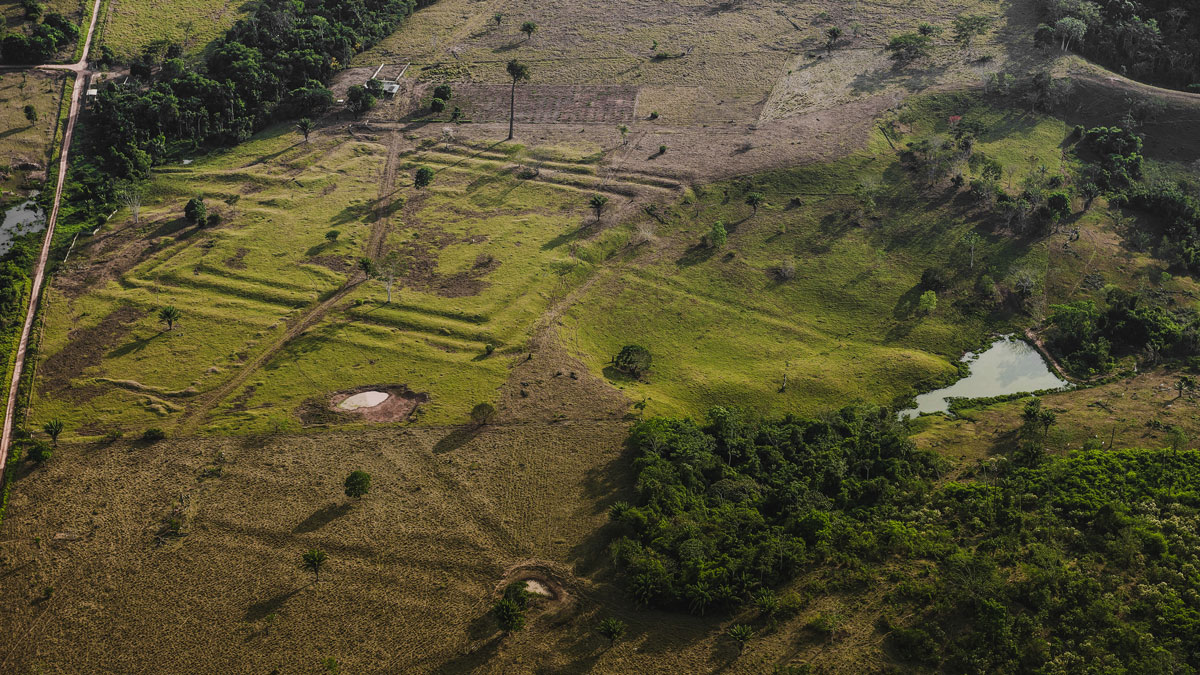
How Ancient Indigenous Societies Made Today’s Amazon More Resilient
Portions of the forest managed by pre-Columbian populations hold higher biomass and are more able to withstand climate change.
Posted inNews
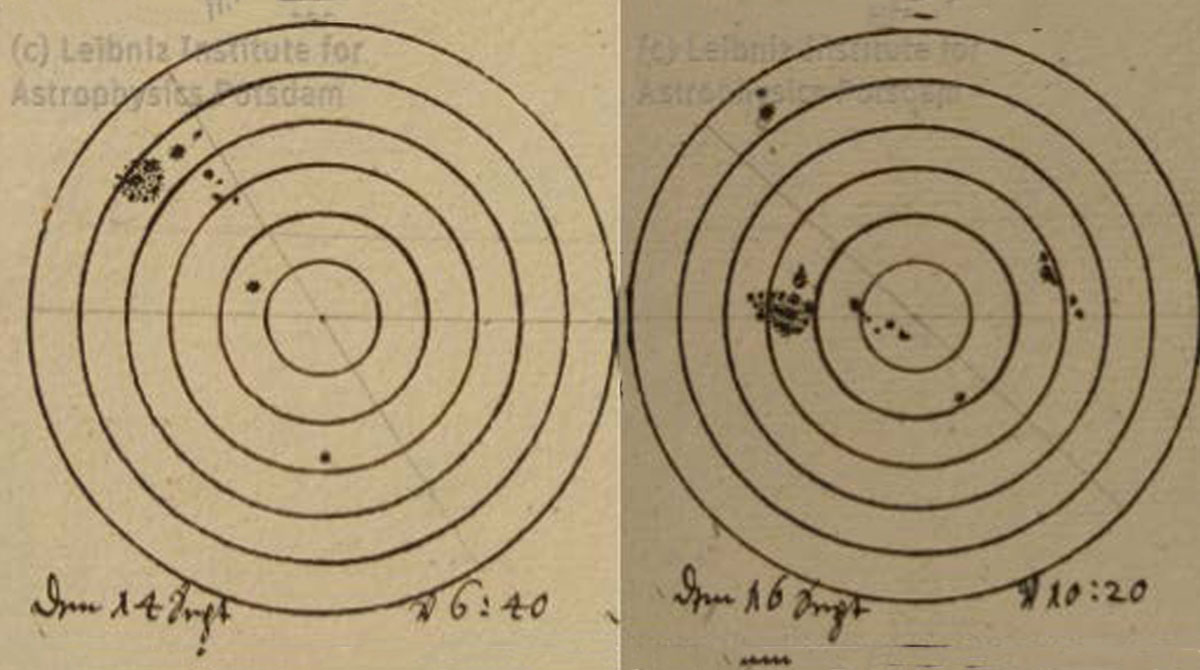
Sunspot Drawings Illuminate 400 Years of Solar Activity
A new computational framework is helping scientists sift through centuries of scientific illustration of the Sun’s spotty surface.