
Despite the increasing popularity of renewable energies like wind and solar power, countries around the world continue to build power plants fueled by coal. Now, researchers have analyzed satellite observations of plants in three countries to test whether the space-based measurements can accurately reveal how much carbon dioxide (CO2) such plants emit.
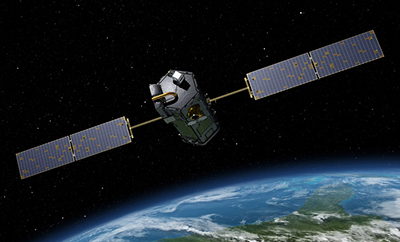
The scientists found that their measurements were consistent to within 17% of reported values, although the satellite they used was not designed for this sort of reconnaissance. NASA built the satellite, called the Orbiting Carbon Observatory 2 (OCO-2), to quantify naturally occurring CO2 over large spatial scales, said Ray Nassar, an atmospheric scientist at Environment and Climate Change Canada in Toronto and leader of the team that analyzed the data.
“I’m excited about this work because it shows what we can do with satellites not designed for this purpose.”
“I’m excited about this work because it shows what we can do with satellites not designed for this purpose,” said Nassar.
Repurposing a Satellite
OCO-2 measures sunlight reflected from Earth. Scientists use this information to calculate the fraction of CO2 molecules present in a column of air by measuring the difference in the amount of sunlight coming into the atmosphere and the amount of sunlight reflected back again. This difference, measured at specific wavelengths, is due to carbon dioxide molecules absorbing sunlight.
Usually, about 400 CO2 molecules mingle with each million air molecules, but a coal-burning power plant can boost that number. Given OCO-2’s sensitivity, which enables it to quantify an increase of just one CO2 molecule above the background value, Nassar and his team suspected that the spacecraft’s instruments could detect spikes in the concentration of CO2 molecules as OCO-2 passed above a coal-burning plant.
To prove the concept, the scientists used data collected between September 2014 and December 2016, in which they identified five instances of OCO-2 having an unobstructed, nearly overhead view of a coal-burning power plant.
Nassar likened OCO-2’s field of view to peeking through a hole in a solid fence.
That’s a small sample, the researchers acknowledge, particularly because there are thousands of power plants burning fossil fuels around the world. Two main factors limited the sample size, Nassar explained. One was that OCO-2’s instruments cannot penetrate through clouds, and “a huge proportion of the observations are lost due to cloud cover,” he said. The other is that OCO-2 can observe only a very small area of the Earth at once, up to 1.3 × 2.3 kilometers, which limits its observing efficiency, Nassar added. He likened OCO-2’s field of view to peeking through a hole in a solid fence.
OCO-2 deputy project scientist Annmarie Eldering, an atmospheric scientist at the California Institute of Technology in Pasadena, Calif., called the new results a “valuable demonstration of the power of remote sensing measurements to see changes of a few parts per million in CO2.”
Aided by Plume Models
The team compared OCO-2 measurements of CO2 concentrations above each of the five power plants—three in the United States (in Kansas, Kentucky, and Ohio), one in India, and one in South Africa—with a model of a plume of CO2 emitted from each plant. One of the tricky steps was accounting for wind, the researchers found, because air movement tended to disperse the CO2, making it harder to quantify an increase in its concentration. The researchers compared the CO2 enhancement in parts per million of the model plume with the observations and determined the model that best fit the data. They then calculated a daily emission amount for each plant, finding values ranging from 30 to 90 kilotons of CO2.
As an accuracy check, the researchers compared their estimates with published data from the U.S. Environmental Protection Agency (EPA). They showed that their estimates of the daily CO2 emissions of the U.S. plants were consistent to within 17% of the EPA-derived values, the team reported in a paper accepted for publication in Geophysical Research Letters. Better estimates of local wind speeds, more sophisticated modeling techniques, and anticipated improved satellite observations may reduce this discrepancy in the future, Nassar said.
Path to Global Power Plant CO2 Monitoring?
Although the general agreement of the team’s emissions tallies with EPA measurements demonstrates OCO-2’s accuracy, “we’re estimating daily emissions from just a snapshot,” noted Nassar. Annual emissions are more relevant to policy makers, and estimating these quantities requires a constellation of satellites making observations over a longer time period.
“You simply can’t get the coverage [from ground-based monitoring] that you can get from satellites.”
“There are a number of other satellites coming down the line that … will improve our capabilities,” he added. These include the Sentinel-7 satellites currently under consideration for launch in the 2020s by the European Union’s Copernicus program.
This new research paves the way for measuring CO2 emissions from power plants on a global scale, said Janne Hakkarainen, an applied mathematician at the Finnish Meteorological Institute in Helsinki. It’s “particularly important” to monitor CO2 emissions from plants in developing countries because ground-based infrastructure to quantify emissions might be less complete there, he said.
“You simply can’t get the coverage [from ground-based monitoring] that you can get from satellites,” said Nassar.
—Katherine Kornei (email: [email protected]; @katherinekornei), Freelance Science Journalist
Citation:
Kornei, K. (2017), Satellite quantifies carbon dioxide from coal-fired power plants, Eos, 98, https://doi.org/10.1029/2017EO084189. Published on 09 October 2017.
Text © 2017. The authors. CC BY-NC-ND 3.0
Except where otherwise noted, images are subject to copyright. Any reuse without express permission from the copyright owner is prohibited.