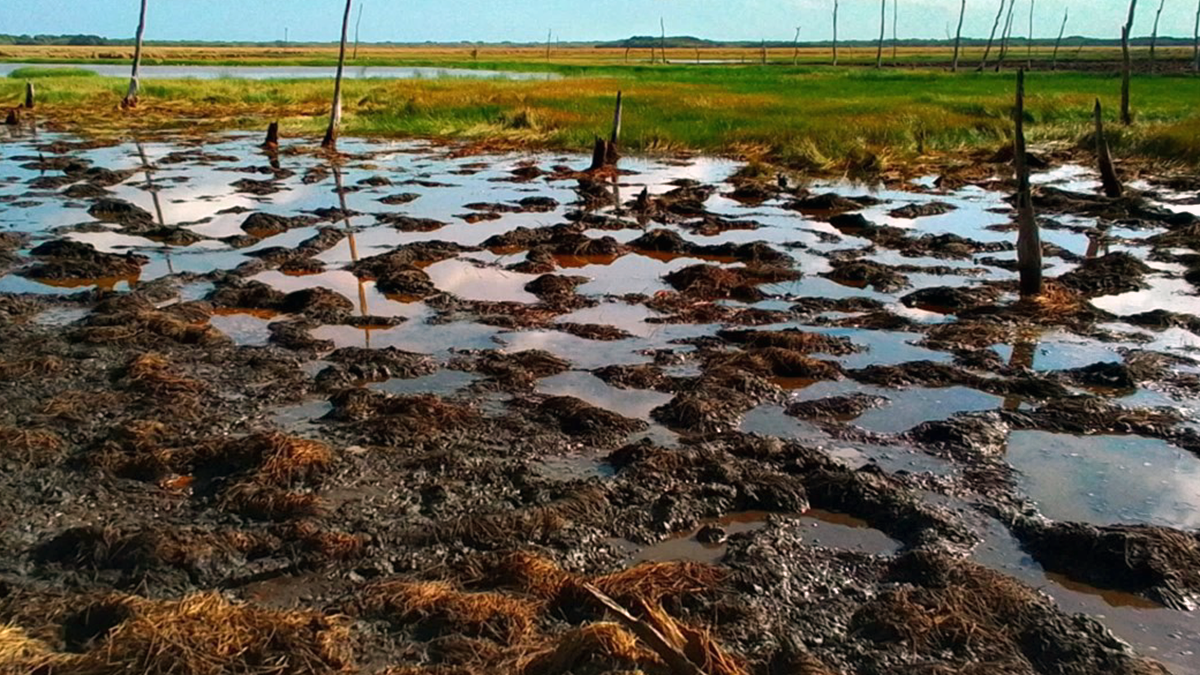
• About
  • Sections
  • Topics
    • Climate
    • Earth Science
    • Oceans
    • Space & Planets
    • Health & Ecosystems
    • Culture & Policy
    • Education & Careers
    • Opinions
  • Projects
    • ENGAGE
    • Editors’ Highlights
    • Editors’ Vox
    • Eos en Español
    • Eos 简体中文版
    • Print Archive
  • Blogs
    • Research & Developments
    • The Landslide Blog
  • Newsletter
  • Submit to Eos
  • AGU.org
  • Career Center
  • Join AGU
  • Give to AGU
  • About
  • Sections
  • Topics
    • Climate
    • Earth Science
    • Oceans
    • Space & Planets
    • Health & Ecosystems
    • Culture & Policy
    • Education & Careers
    • Opinions
  • Projects
    • ENGAGE
    • Editors’ Highlights
    • Editors’ Vox
    • Eos en Español
    • Eos 简体中文版
    • Print Archive
  • Blogs
    • Research & Developments
    • The Landslide Blog
  • Newsletter
  • Submit to Eos
Skip to content
  • AGU.org
  • Career Center
  • Join AGU
  • Give to AGU
Eos

Eos

Science News by AGU

Support Eos
Sign Up for Newsletter
  • About
  • Sections
  • Topics
    • Climate
    • Earth Science
    • Oceans
    • Space & Planets
    • Health & Ecosystems
    • Culture & Policy
    • Education & Careers
    • Opinions
  • Projects
    • ENGAGE
    • Editors’ Highlights
    • Editors’ Vox
    • Eos en Español
    • Eos 简体中文版
    • Print Archive
  • Blogs
    • Research & Developments
    • The Landslide Blog
  • Newsletter
  • Submit to Eos

Ankur R. Desai

Department of Atmospheric and Oceanic Sciences, University of Wisconsin–Madison

Photo of a forest's treetops during autumn.
Posted inEditors' Highlights

The Invisible Hand of Carbon Dioxide on Forest Productivity

by Ankur R. Desai 11 July 202411 July 2024

A statistically robust approach applied to long-term flux measurements quantifies forest ecosystem response to increasing atmospheric carbon dioxide, providing a valuable benchmark for climate models.

Photo of a wetland
Posted inEditors' Highlights

When You’re a Wet(land), You’re A Wet(land) All the Way

by Ankur R. Desai 9 April 20248 April 2024

Wetlands and their methane emissions require careful consideration for incorporation in Earth system models with many advances made over the past 30 years.

Diagrams showing footprint, flux maps and hotspot maps.
Posted inEditors' Highlights

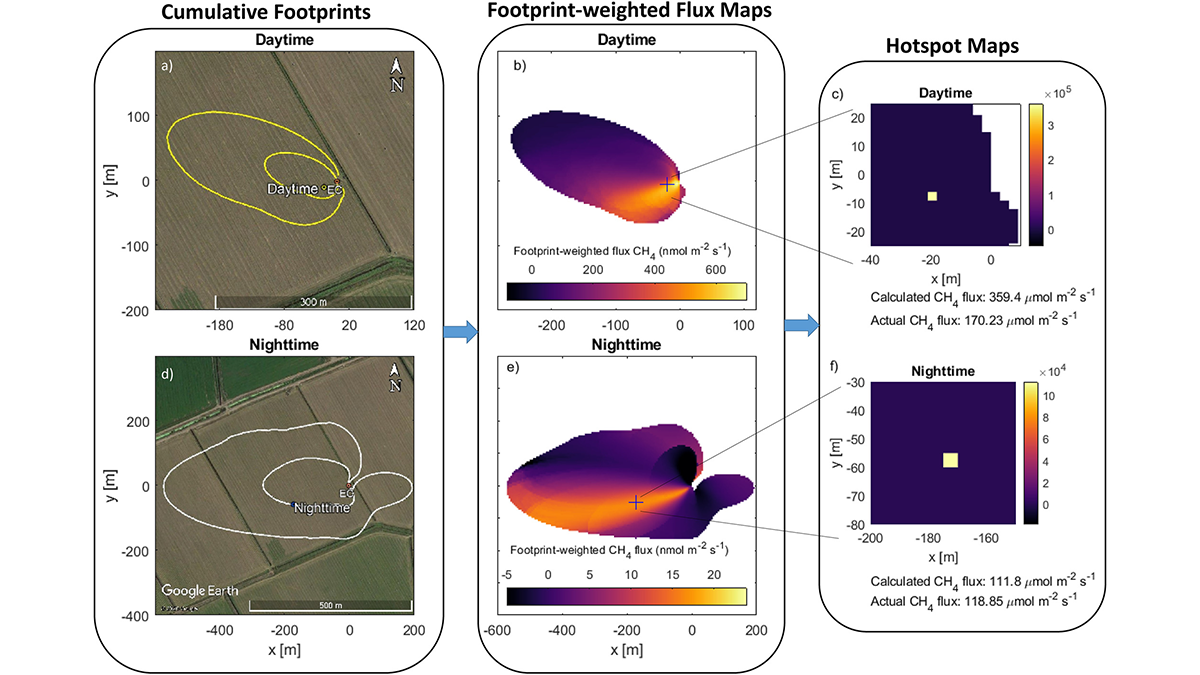
Sleuthing for Culprits of Greenhouse Gas Emissions

by Ankur R. Desai 23 August 202228 September 2022

A new approach to detect hot spots of methane emissions with eddy covariance flux towers proves to be a worthy contender.

Three field photographs showing different vegetation types.
Posted inEditors' Highlights

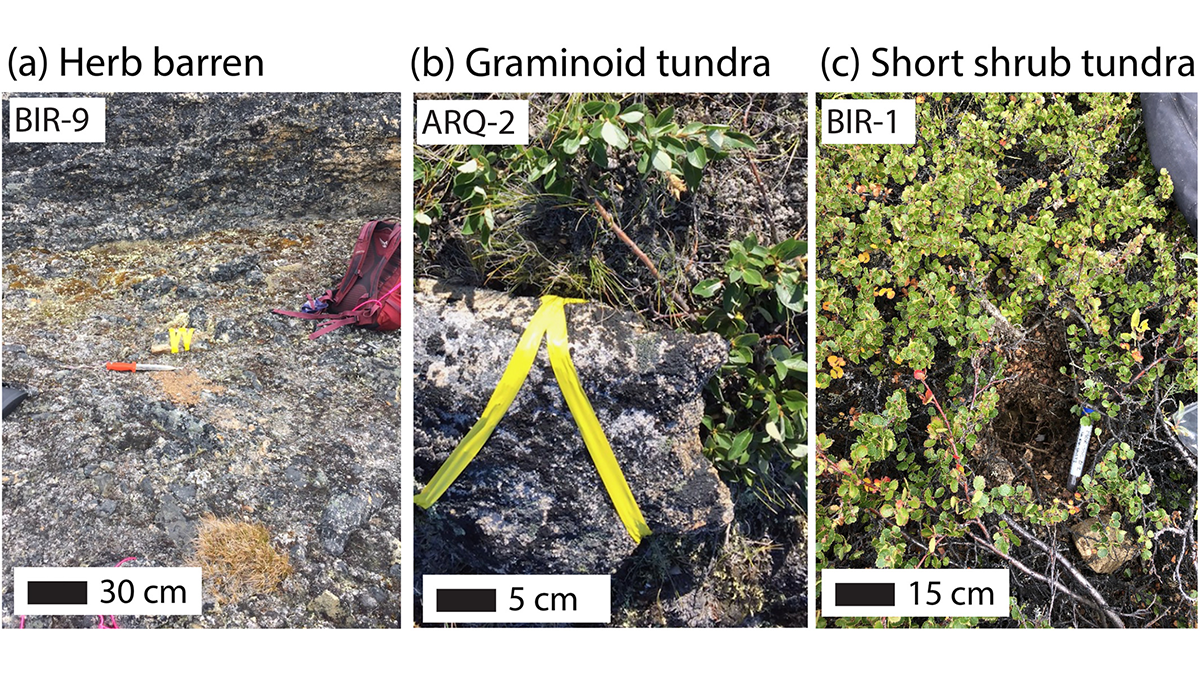
It’s Cool to be Short When You’re in the Arctic Permafrost

by Ankur R. Desai 15 July 202225 July 2022

Extensive ground temperature measurements complicate our understanding of how vegetation cover, snow duration, and microtopography influence the pace of permafrost thaw in a changing climate.

Aerial image of the study area and photograph of eddy covariance tower equipped with all measuring devices.
Posted inEditors' Highlights

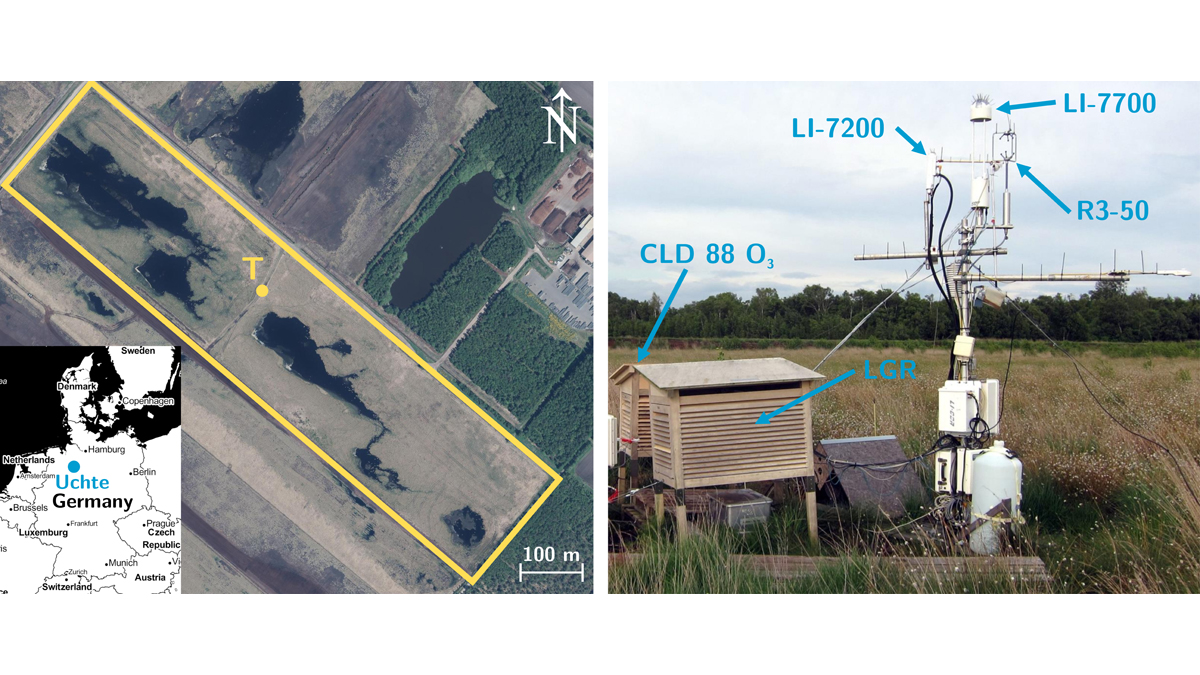
Being Cool is a Slow Ride When You’re a Restored Wetland

by Ankur R. Desai 16 February 202215 March 2022

Restoring formerly drained peat wetlands can mitigate climate-warming emissions but the reward takes patience.

Two plots showing measurements of soil and ecosystem metabolism
Posted inEditors' Highlights

Dueling Eyes on Ecosystem Metabolism Tell Diverging Stories

by Ankur R. Desai 2 April 202122 December 2021

Multiple state-of-the-art independent observing systems consistently disagree on magnitudes and patterns of ecosystem metabolism of carbon dioxide, but together can shed new insight.

The University of Wyoming King Air samples water and carbon fluxes over an autumn-forested landscape in northern Wisconsin, USA, as part of the CHEESEHEAD19 study.
Posted inEditors' Vox

Advances in Scaling and Modeling of Land-Atmosphere Interactions

by Ankur R. Desai, B. Butterworth, S. Metzger and M. Mauder 4 March 202122 December 2021

Papers are invited for a new cross-journal special collection on insights in scaling land-atmosphere interactions from field experiments, data analyses, and modeling.

Chart showing mercury stable isotope concentrations in tree rings
Posted inEditors' Highlights

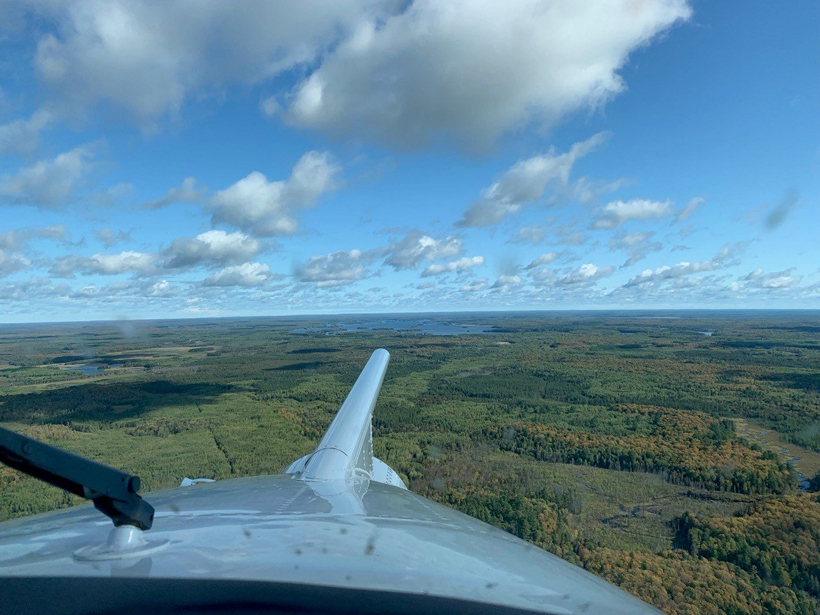
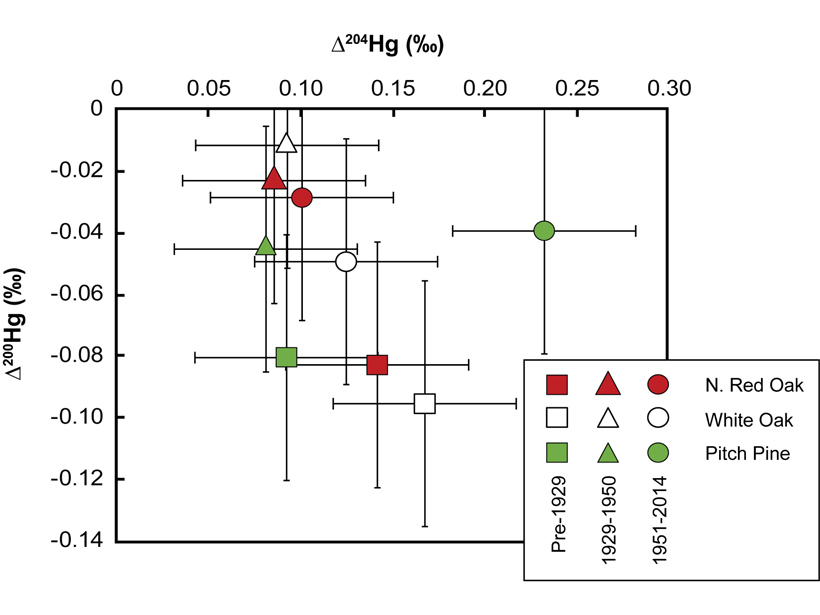
Trees Are Watching Us and Our Actions

by Ankur R. Desai 31 March 20205 May 2022

Annual growth rings in trees tell us more than climate history; they can also document the rise and fall of human industrial activities.

Flowchart showing summary of options to analyze time trends in tree ring data
Posted inEditors' Highlights

The Many Intertwined Stories of Tree Rings

by Ankur R. Desai 5 September 201926 August 2019

Trees grow as they age, but it’s not straightforward to tease out how that growth changes over a century of environmental change.

Spatial cluster analysis of carbon uptake in Mexico
Posted inEditors' Highlights

Stocking a Proper Buffet for a Megadiverse Smorgasbord

by Ankur R. Desai 19 July 201924 February 2023

Mexico’s megadiverse biota challenge observation network design for efficient sampling, but novel methods can provide guidance and tests of representativeness.

Posts pagination

1 2 Older posts
A view of a Washington, D.C., skyline from the Potomac River at night. The Lincoln Memorial (at left) and the Washington Monument (at right) are lit against a purple sky. Over the water of the Potomac appear the text “#AGU24 coverage from Eos.”

Features from AGU Publications

Research Spotlights

Storm Prediction Gets 10 Times Faster Thanks to AI

20 May 202520 May 2025
Editors' Highlights

Inferring River Discharge from Google Earth Images

20 May 202515 May 2025
Editors' Vox

Decoding Crop Evapotranspiration

6 May 20256 May 2025
Eos logo at left; AGU logo at right

About Eos
ENGAGE
Awards
Contact

Advertise
Submit
Career Center
Sitemap

© 2025 American Geophysical Union. All rights reserved Powered by Newspack