• About
  • Sections
  • Topics
    • Climate
    • Earth Science
    • Oceans
    • Space & Planets
    • Health & Ecosystems
    • Culture & Policy
    • Education & Careers
    • Opinions
  • Projects
    • Postcards From the Field
    • ENGAGE
    • Editors’ Highlights
    • Editors’ Vox
    • Eos en Español
    • Eos 简体中文版
    • Print Archive: 2015–2025
  • Science Policy Tracker
  • Blogs
    • Research & Developments
    • The Landslide Blog
  • Newsletter
  • Submit to Eos
  • AGU.org
  • Career Center
  • Join AGU
  • Give to AGU
  • About
  • Sections
  • Topics
    • Climate
    • Earth Science
    • Oceans
    • Space & Planets
    • Health & Ecosystems
    • Culture & Policy
    • Education & Careers
    • Opinions
  • Projects
    • Postcards From the Field
    • ENGAGE
    • Editors’ Highlights
    • Editors’ Vox
    • Eos en Español
    • Eos 简体中文版
    • Print Archive: 2015–2025
  • Science Policy Tracker
  • Blogs
    • Research & Developments
    • The Landslide Blog
  • Newsletter
  • Submit to Eos
Skip to content
  • AGU.org
  • Career Center
  • Join AGU
  • Give to AGU
Eos

Eos

Science News by AGU

Support Eos
Sign Up for Newsletter
  • About
  • Sections
  • Topics
    • Climate
    • Earth Science
    • Oceans
    • Space & Planets
    • Health & Ecosystems
    • Culture & Policy
    • Education & Careers
    • Opinions
  • Projects
    • Postcards From the Field
    • ENGAGE
    • Editors’ Highlights
    • Editors’ Vox
    • Eos en Español
    • Eos 简体中文版
    • Print Archive: 2015–2025
  • Science Policy Tracker
  • Blogs
    • Research & Developments
    • The Landslide Blog
  • Newsletter
  • Submit to Eos

Christopher Piecuch

Associate Editor, Earth’s Future

Graph showing the relationship between global-mean surface and rate of global-mean sea-level rise.
Posted inEditors' Highlights

Surface Temperature Sets the Pace of Sea Level Rise

by Christopher Piecuch 31 October 202221 February 2023

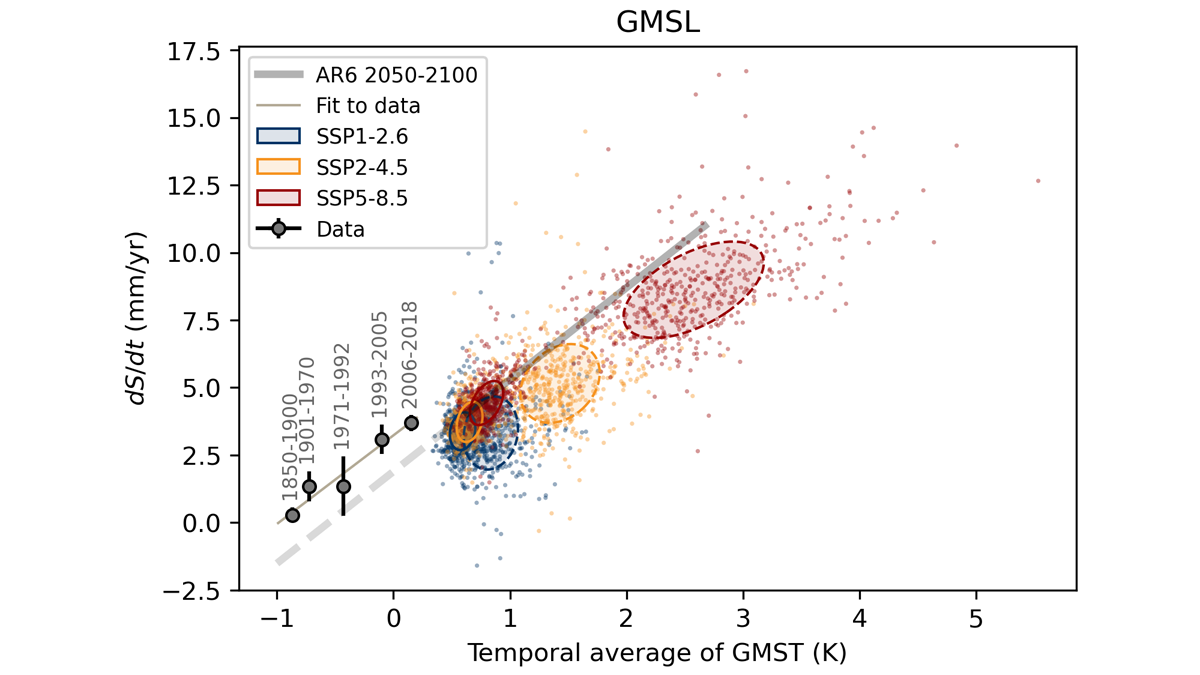
Reining in global mean sea level rise from land-ice wastage and ocean thermal expansion requires reducing global mean surface temperatures to near-preindustrial values.

A view of a bridge, with the New Orleans skyline visible in the distance between the bridge and the water. A purple tint, a teal curved line representing a river, and the text “#AGU25 coverage from Eos” overlie the photo.

Features from AGU Publications

Research Spotlights

Denitrification Looks Different in Rivers Versus Streams

16 January 202616 January 2026
Editors' Highlights

ALMA’s New View of the Solar System

16 January 202616 January 2026
Editors' Vox

Bridging the Gap: Transforming Reliable Climate Data into Climate Policy

16 January 202616 January 2026
Eos logo at left; AGU logo at right

About Eos
ENGAGE
Awards
Contact

Advertise
Submit
Career Center
Sitemap

© 2026 American Geophysical Union. All rights reserved Powered by Newspack