• About
  • Sections
  • Topics
    • Climate
    • Earth Science
    • Oceans
    • Space & Planets
    • Health & Ecosystems
    • Culture & Policy
    • Education & Careers
    • Opinions
  • Projects
    • ENGAGE
    • Editors’ Highlights
    • Editors’ Vox
    • Eos en Español
    • Eos 简体中文版
    • Print Archive
  • Blogs
    • Research & Developments
    • The Landslide Blog
  • Newsletter
  • Submit to Eos
  • AGU.org
  • Career Center
  • Join AGU
  • Give to AGU
  • About
  • Sections
  • Topics
    • Climate
    • Earth Science
    • Oceans
    • Space & Planets
    • Health & Ecosystems
    • Culture & Policy
    • Education & Careers
    • Opinions
  • Projects
    • ENGAGE
    • Editors’ Highlights
    • Editors’ Vox
    • Eos en Español
    • Eos 简体中文版
    • Print Archive
  • Blogs
    • Research & Developments
    • The Landslide Blog
  • Newsletter
  • Submit to Eos
Skip to content
  • AGU.org
  • Career Center
  • Join AGU
  • Give to AGU
Eos

Eos

Science News by AGU

Support Eos
Sign Up for Newsletter
  • About
  • Sections
  • Topics
    • Climate
    • Earth Science
    • Oceans
    • Space & Planets
    • Health & Ecosystems
    • Culture & Policy
    • Education & Careers
    • Opinions
  • Projects
    • ENGAGE
    • Editors’ Highlights
    • Editors’ Vox
    • Eos en Español
    • Eos 简体中文版
    • Print Archive
  • Blogs
    • Research & Developments
    • The Landslide Blog
  • Newsletter
  • Submit to Eos

Minghua Zhang

Editor-in-Chief, JGR: Atmospheres

Four graphs showing the percent area covered by atmospheric rivers in the northern and southern hemispheres.
Posted inEditors' Highlights

Comparing Methods for Analysis of Atmospheric Rivers

by Minghua Zhang 4 July 202230 January 2024

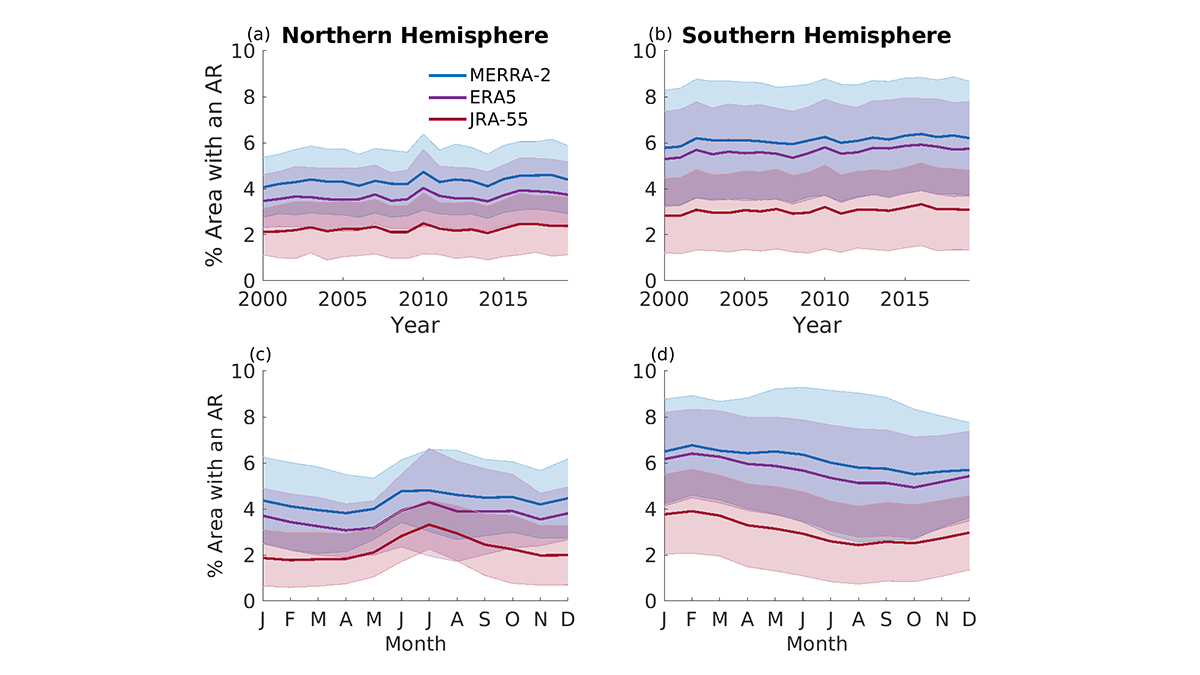
Results from the Atmospheric River Tracking Method Intercomparison Project (ARTMIP) describe the similarity and difference of using eleven detection algorithms and three reanalysis products.

Photo of S-band radar site with Mt. Aragats in the background.
Posted inEditors' Highlights

Radar Diagnosis of the Thundercloud Electron Accelerator

by Minghua Zhang 14 June 202210 March 2023

Altitude-resolved S-band radar observations of graupel are used to decipher thunderstorm ground enhancements in surface electric field and gamma ray flux.

Graph showing contribution of each large-scale atmospheric variable on the y-axis to predicted total convective area.
Posted inEditors' Highlights

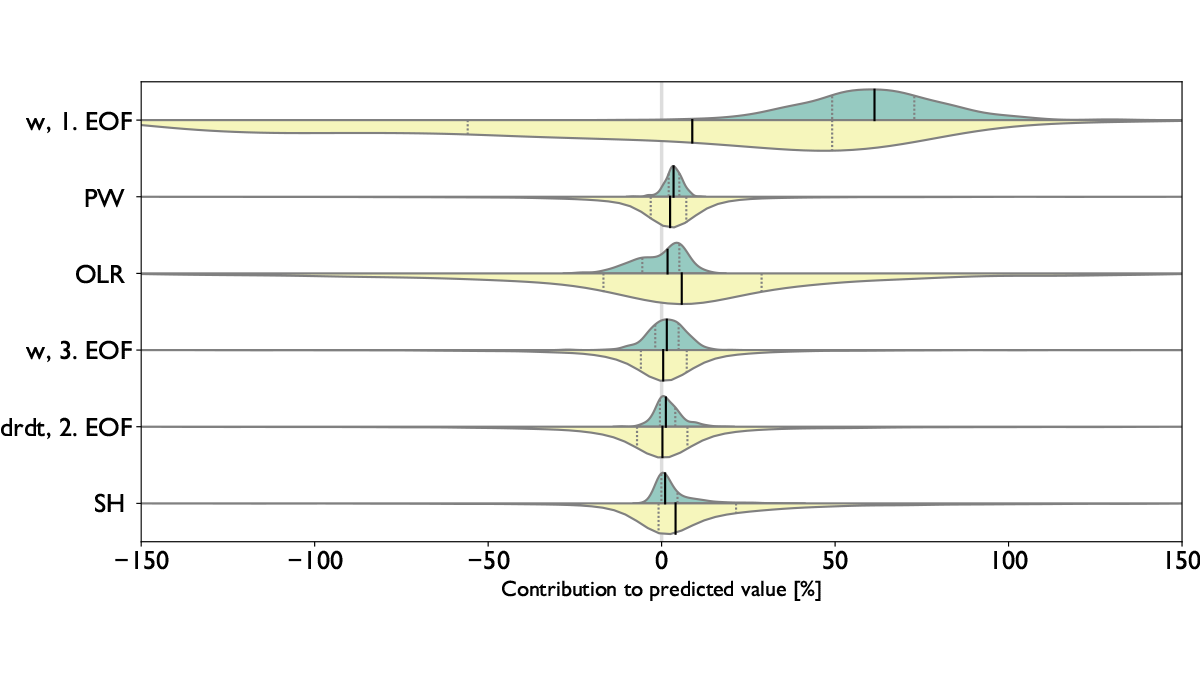
Using Artificial Intelligence to Study Convection

by Minghua Zhang 8 June 202223 January 2023

Machine learning techniques are used to examine relationships between the large-scale state of the atmosphere, the convection total area, and the degree of organization in northern Australia.

Diagrams showing cross correlation of cloud-feedback components in the multi-model ensemble.
Posted inEditors' Highlights

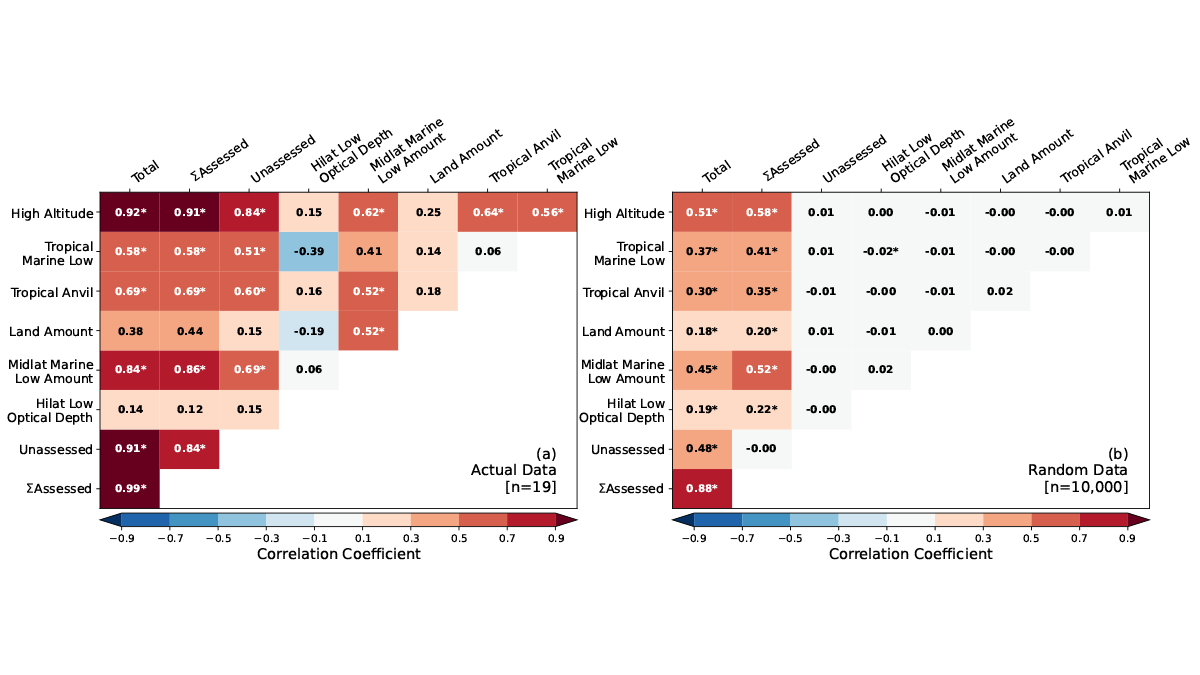
Cloud Feedbacks in CMIP6 Models Versus Expert Synthesis

by Minghua Zhang 6 June 202214 September 2022

Models with smallest feedback errors are found to have moderate cloud feedbacks and equilibrium climate sensitivity of 3 to 4 degrees of warming when the concentration of carbon dioxide is doubled.

Maps of the northern (left) and southern (right) hemispheres showing temperature anomalies relative to the 1961–1990 mean for the month of August 2016 using an alternative gridding method
Posted inEditors' Highlights

New Land Surface Air Temperature Global Dataset

by Minghua Zhang 17 March 202113 February 2023

The fifth major update of land surface air temperature data from the Climatic Research Unit and the Met Office has extended the time series, included more stations, and used better processing methods.

Two charts comparing annual global average temperature anomaly series relative to 1961–1990 (top) and 1850–1900 (bottom)
Posted inEditors' Highlights

New Global Surface Temperature Dataset Spans 170 Years

by Minghua Zhang 8 March 202113 February 2023

HadCRUT5, the new version of the Met Office Hadley Centre/Climatic Research Unit global surface temperature dataset from 1850 to 2018, has extended and improved the previous temperature record.

Plot showing pattern correlations between models and observations for simulated annual mean climatology over the period 1980–1999 for five climate variables
Posted inEditors' Highlights

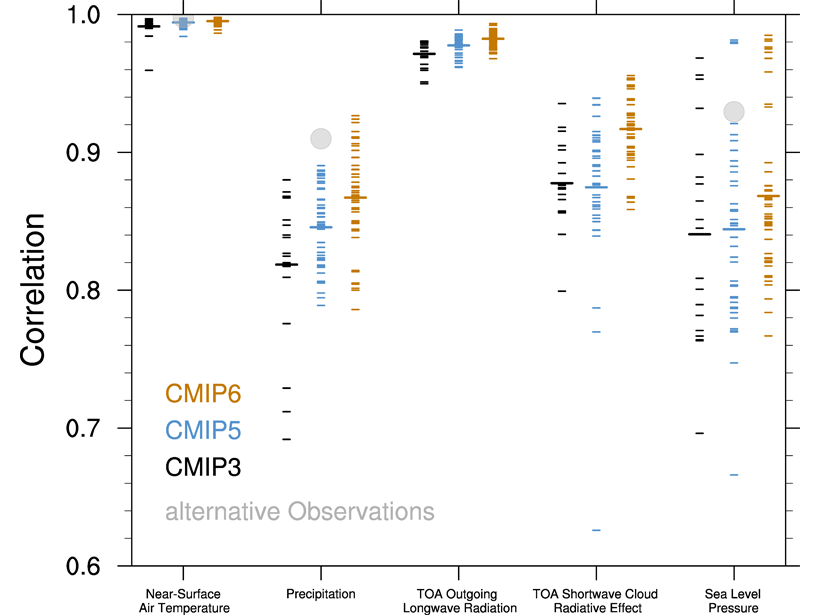
Climate Modeling Progress in the Past 15 Years

by Minghua Zhang 27 January 202112 January 2022

An assessment and comparison of the performances of climate models participating in three phases of the Coupled Model Intercomparison Project (CMIP3, CMIP5 and CMIP6).

Part of a world map showing the number of lightning flashes per square kilometer in each year
Posted inEditors' Highlights

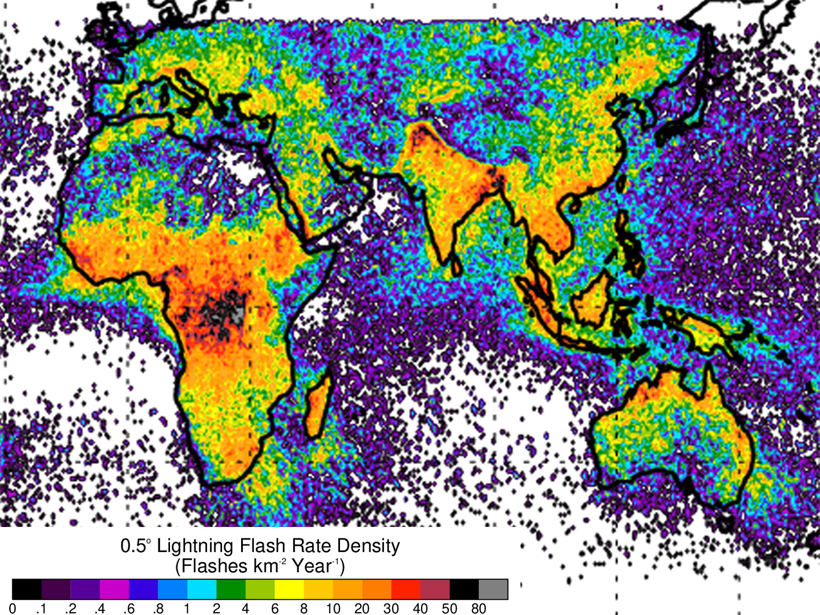
A New Look at Global Lightning from the Space Station

by Minghua Zhang 9 September 20206 July 2022

The Lightning Imaging Sensor on the International Space Station provides an expanded view of global lightning that improves scientific understanding of the Earth as well as public safety.

World map showing the difference of a metric of extreme hot days between two periods
Posted inEditors' Highlights

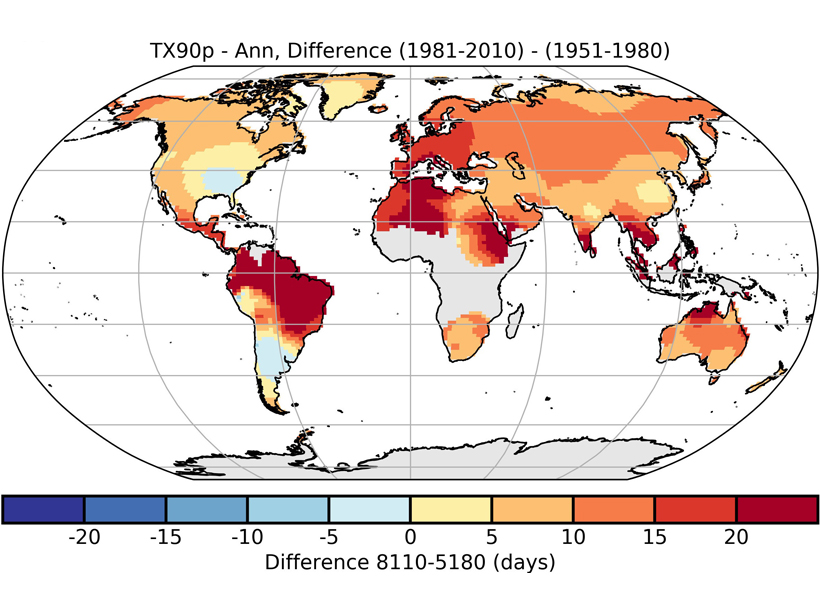
A New Dataset of Temperature and Precipitation Extremes

by Minghua Zhang 8 September 202013 February 2023

HadEX3 is an updated dataset of gridded temperature and precipitation extremes, that covers the period of 1901 to 2018 and has improved spatio-temporal coverage.

Chart showing concurrent detection of streamer corona discharges from space and the ground
Posted inEditors' Highlights

Streamer Corona Discharges in Thunderstorms Detected from Space

by Minghua Zhang 2 September 202027 January 2022

Concurrent detection from space and the ground of blue optical flashes from streamer corona discharges at altitudes between 8.5 and 14 kilometers and radio waves.

Posts pagination

Newer posts 1 2 3 4 Older posts
A view of a Washington, D.C., skyline from the Potomac River at night. The Lincoln Memorial (at left) and the Washington Monument (at right) are lit against a purple sky. Over the water of the Potomac appear the text “#AGU24 coverage from Eos.”

Features from AGU Publications

Research Spotlights

Simplicity May Be the Key to Understanding Soil Moisture

23 May 202523 May 2025
Editors' Highlights

Creep Cavitation May Lead to Earthquake Nucleation

22 May 202521 May 2025
Editors' Vox

Decoding Crop Evapotranspiration

6 May 20256 May 2025
Eos logo at left; AGU logo at right

About Eos
ENGAGE
Awards
Contact

Advertise
Submit
Career Center
Sitemap

© 2025 American Geophysical Union. All rights reserved Powered by Newspack