Source: Journal of Geophysical Research: Atmospheres
Changes in climate extremes can have significant impacts on human society and ecosystems. The HadEX3 dataset describes and uses the newest source of comprehensive observations to quantify the changes of these extremes in daily temperature and precipitation.
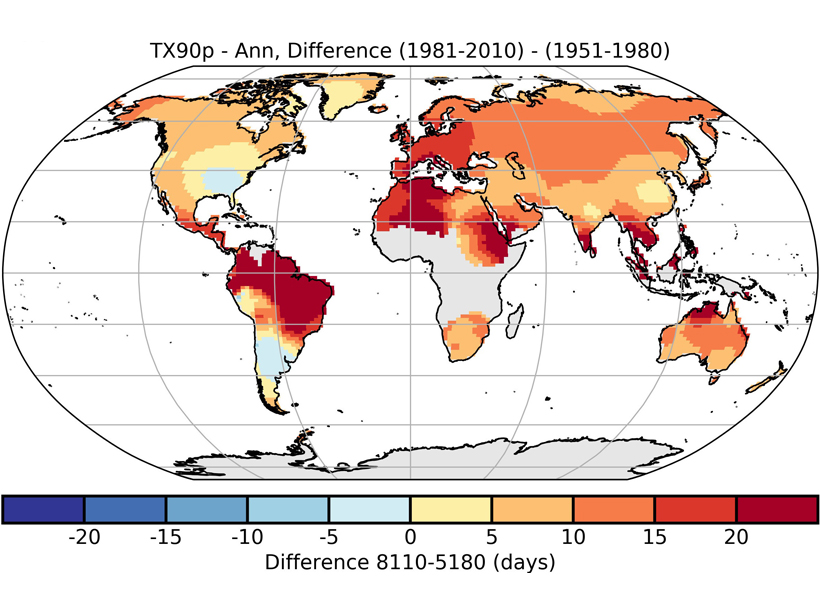
Dunn et al. [2020] show that the extremes related to daily minimum temperatures are changing faster than the maximum, all of which are consistent with widespread global warming. Spatial changes in the linear trends of precipitation indices over 1951-2018 are less homogeneous than those for temperature indices, but the fraction of precipitation falling in heavy events globally has increased.
Citation: Dunn, R. J. H., Alexander, L. V., Donat, M. G., Zhang, X., Bador, M., Herold, N., et al. [2020]. Development of an updated global land in situ‐based data set of temperature and precipitation extremes: HadEX3. Journal of Geophysical Research: Atmospheres, 125, e2019JD032263. https://doi.org/10.1029/2019JD032263
—Minghua Zhang, Editor in Chief, JGR: Atmospheres
Text © 2020. The authors. CC BY-NC-ND 3.0
Except where otherwise noted, images are subject to copyright. Any reuse without express permission from the copyright owner is prohibited.