The simplest model, based on polynomials, yields the best performance.
precipitation
Posted inResearch & Developments
6 Ways This Year’s “Super El Niño” Could Affect Climate, Humans, and Marine Creatures
The key word here is “could.” Experts emphasize that no two El Niños are alike.
Posted inOpinions
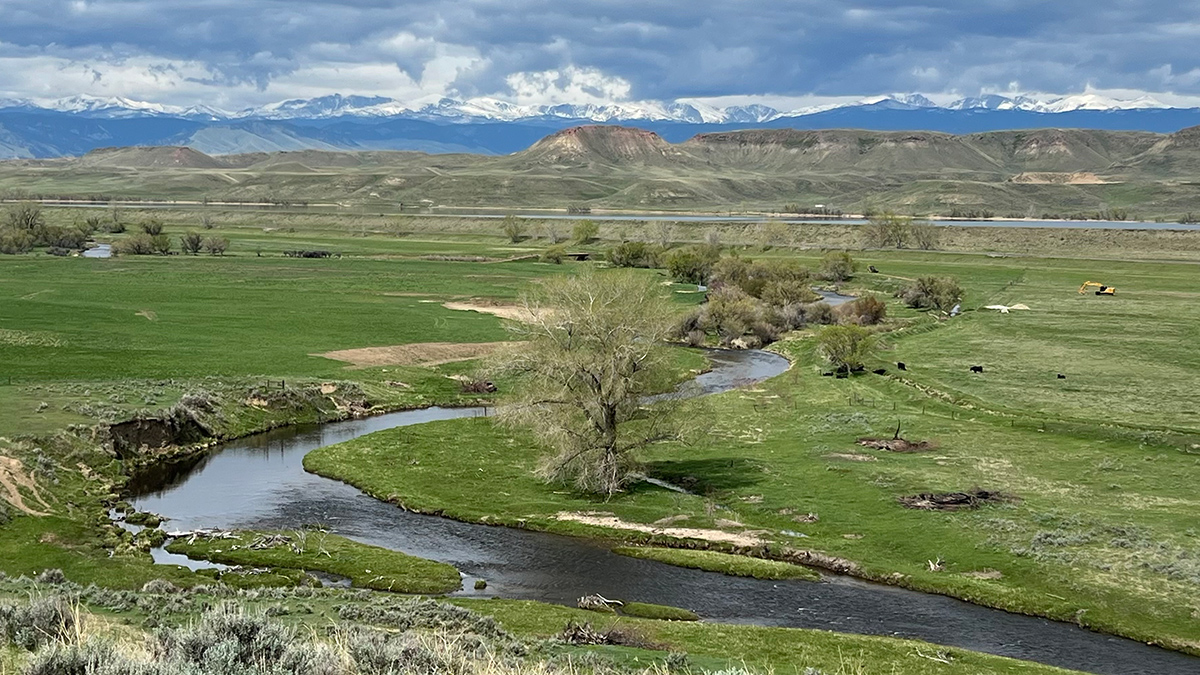
Archetypes Could Accelerate Agricultural Adaptation to Less Snowpack
Measurable characteristics can be used to develop archetypes of complex agricultural systems, helping stakeholders to assess where different adaptation strategies are more likely to succeed.
Posted inResearch Spotlights
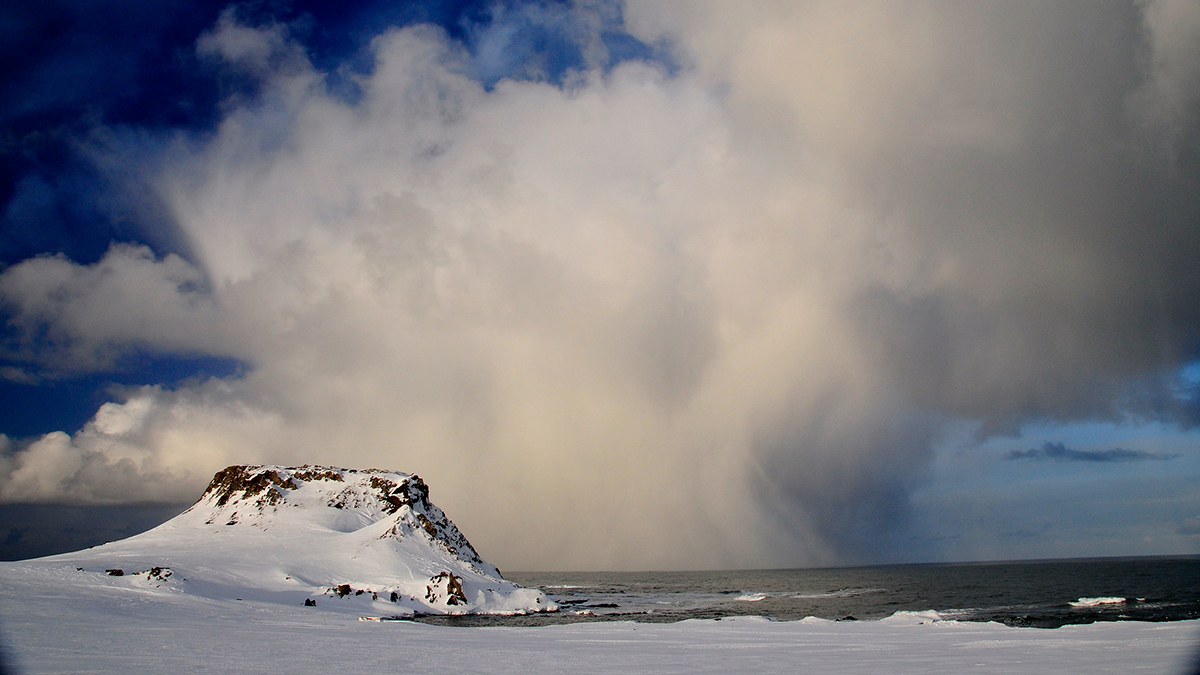
Rivers in the Antarctic Sky, Captured in 3D
A new study shows that atmospheric rivers may be responsible for up to 90% of Antarctica’s annual precipitation.
Posted inNews
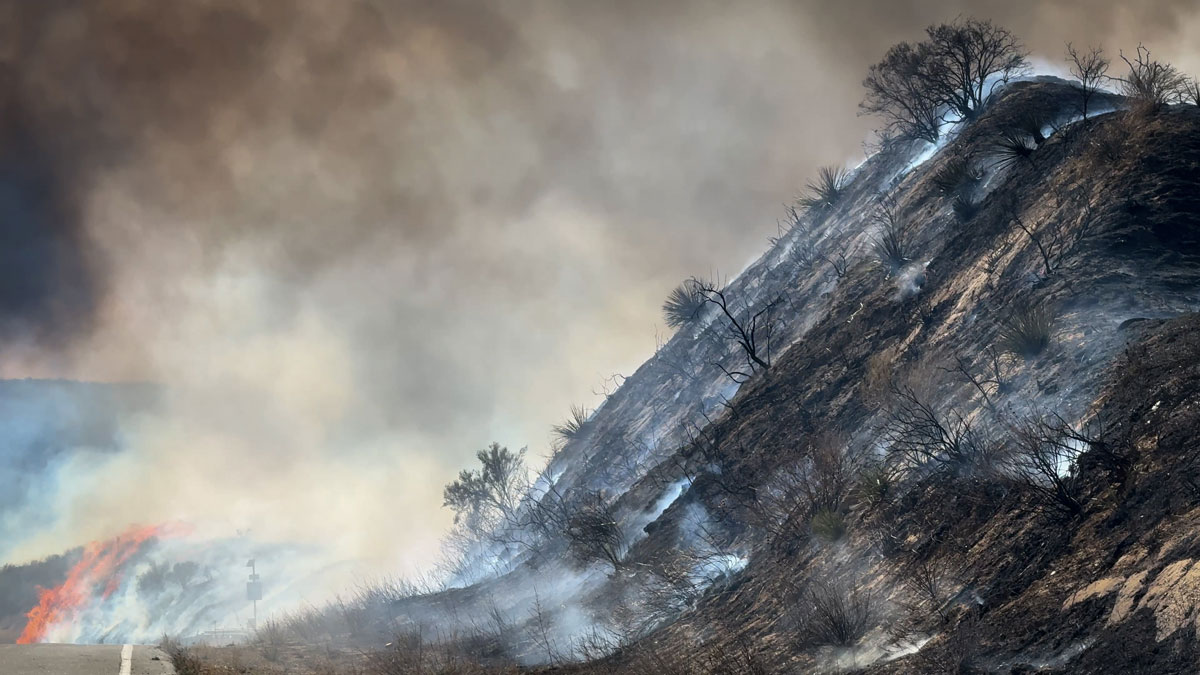
Low Snow in Eurasia Linked to Wildfires in California
Scientists found that low autumn snow levels in western Eurasia are associated with dry, warm winters in California, increasing the Golden State’s wildfire risk.
Posted inNews
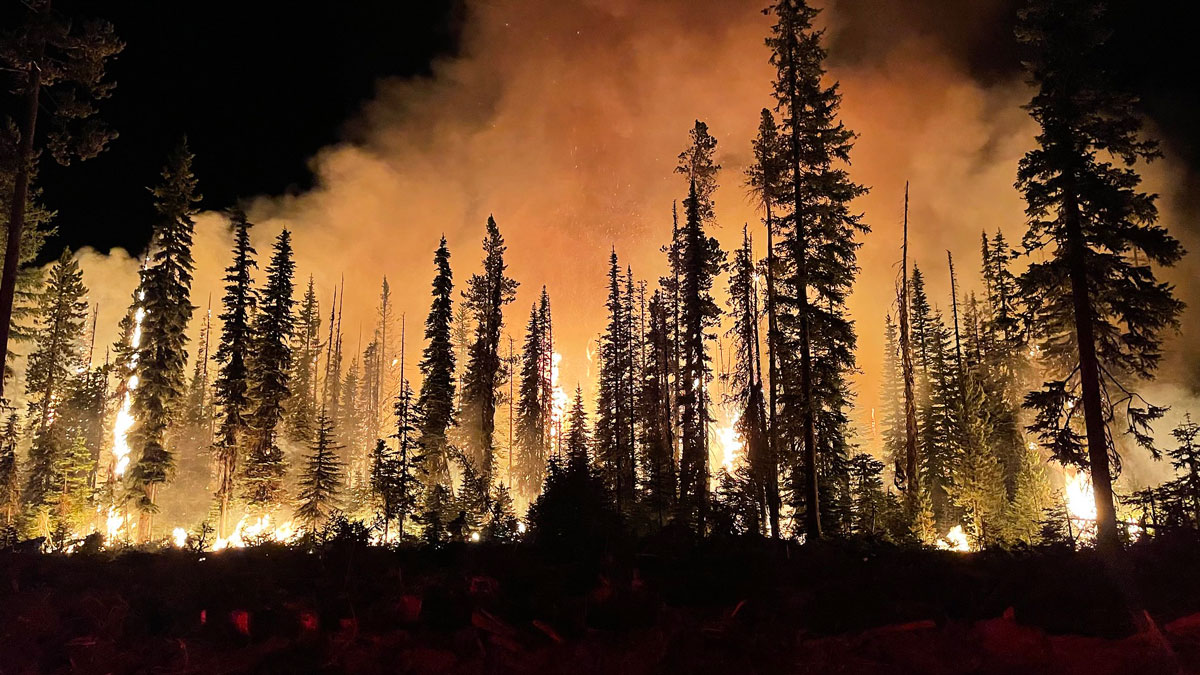
Most of the U.S. West Will Face Above-Normal Wildfire Risk This Summer
The National Interagency Fire Center predicts elevated wildfire potential across much of the West and many Southeast states through August.
Posted inResearch Spotlights
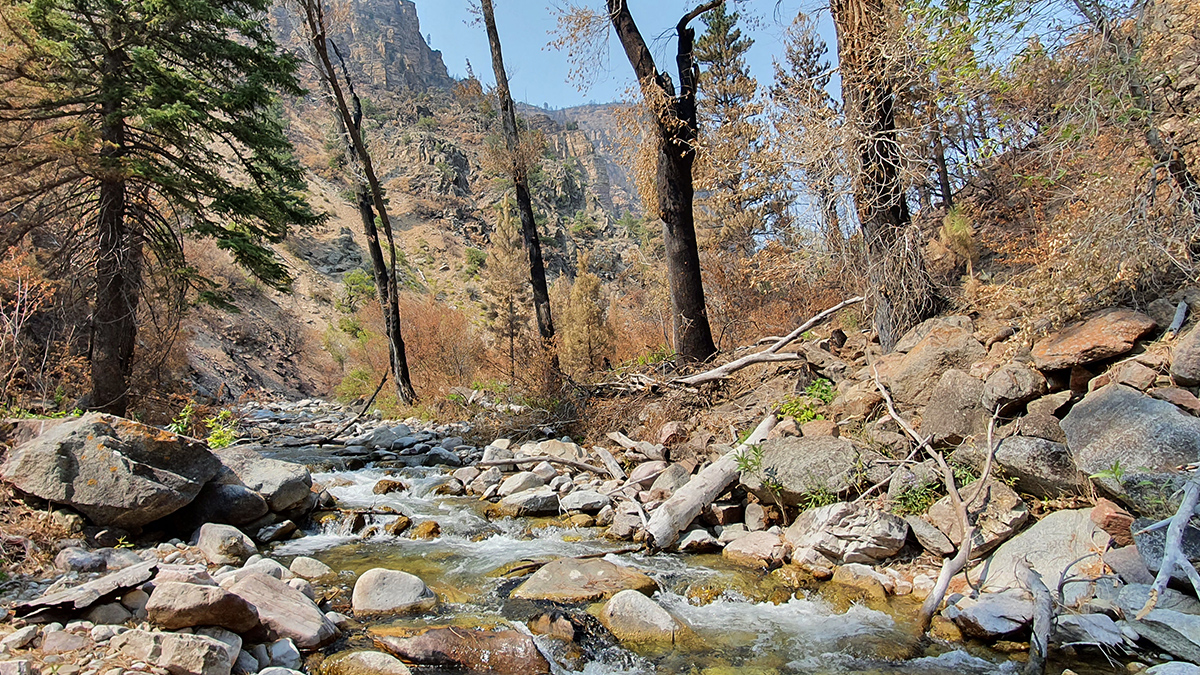
How Wildfires Worsen Flood Risk
A new approach to analyzing watersheds shows how storms occurring after a wildfire can have higher flooding risk than similar storms that occurred before a fire.
Posted inEditors' Highlights
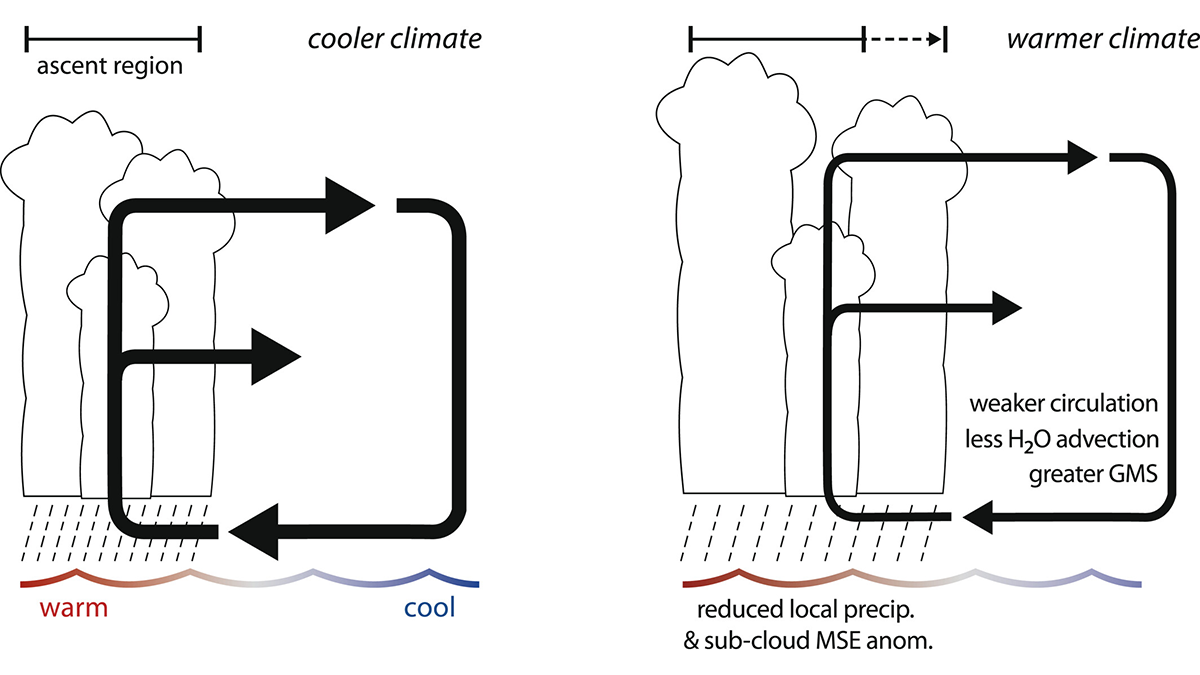
The “Wet-Gets-Wetter” Response to Climate Change Does Not Always Apply
While the precipitation response to a warming climate is often stated as the “wet gets wetter,” this response does not apply to east-west overturning circulations like the Pacific Walker circulation.
Posted inEditors' Highlights
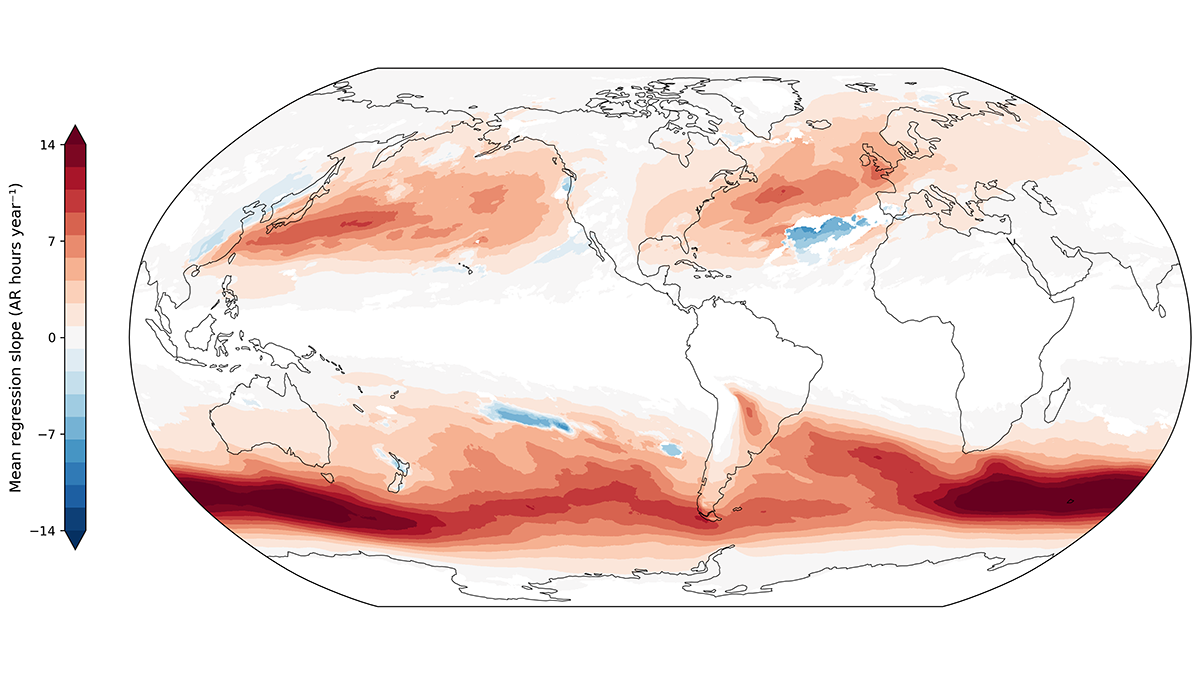
Future Hotspots of Hazardous Rivers in the Atmosphere
Atmospheric rivers can produce heavy precipitation and associated hazards worldwide. A new study identifies regions where these hazards have already, and will further, increase with global heating.
Posted inScience Updates
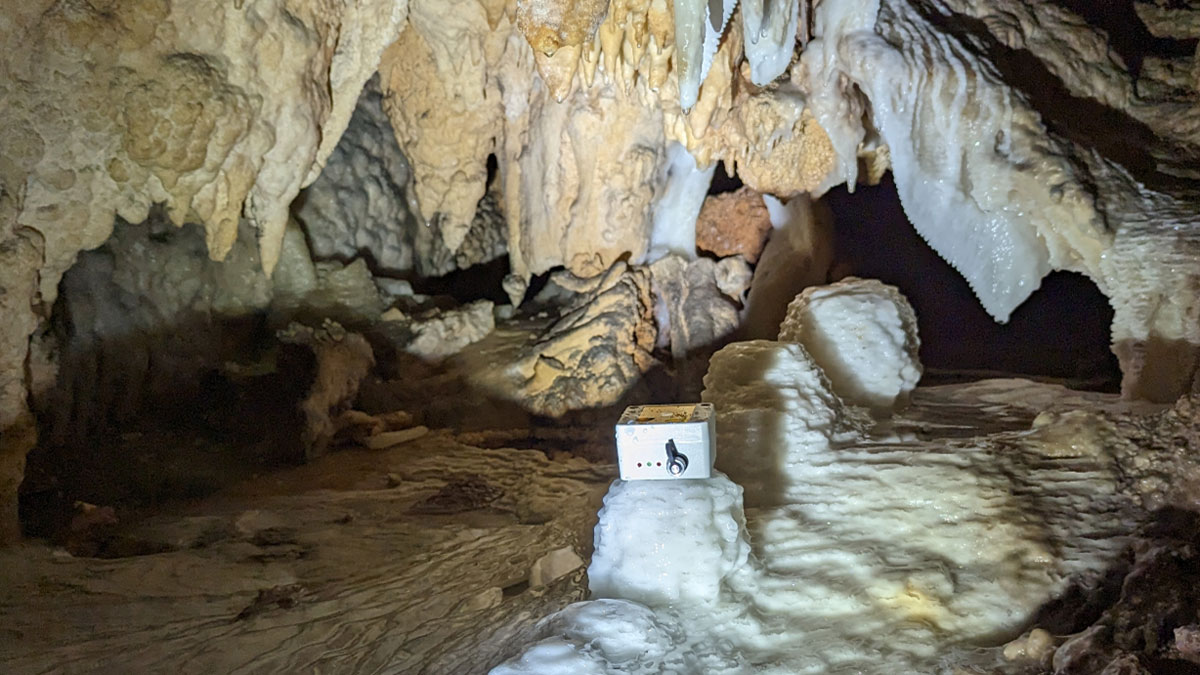
When Does Rainfall Become Recharge?
Counting drips in caves is helping to reveal how much precipitation is needed to start refilling underground aquifers.