• About
  • Sections
  • Topics
    • Climate
    • Earth Science
    • Oceans
    • Space & Planets
    • Health & Ecosystems
    • Culture & Policy
    • Education & Careers
    • Opinions
  • Projects
    • Postcards From the Field
    • ENGAGE
    • Editors’ Highlights
    • Editors’ Vox
    • Eos en Español
    • Eos 简体中文版
    • Print Archive: 2015–2025
  • Science Policy Tracker
  • Blogs
    • Research & Developments
    • The Landslide Blog
  • Newsletter
  • Submit to Eos
  • AGU.org
  • Career Center
  • Join AGU
  • Give to AGU
  • About
  • Sections
  • Topics
    • Climate
    • Earth Science
    • Oceans
    • Space & Planets
    • Health & Ecosystems
    • Culture & Policy
    • Education & Careers
    • Opinions
  • Projects
    • Postcards From the Field
    • ENGAGE
    • Editors’ Highlights
    • Editors’ Vox
    • Eos en Español
    • Eos 简体中文版
    • Print Archive: 2015–2025
  • Science Policy Tracker
  • Blogs
    • Research & Developments
    • The Landslide Blog
  • Newsletter
  • Submit to Eos
Skip to content
  • AGU.org
  • Career Center
  • Join AGU
  • Give to AGU
Eos

Eos

Science News by AGU

Support Eos
Sign Up for Newsletter
  • About
  • Sections
  • Topics
    • Climate
    • Earth Science
    • Oceans
    • Space & Planets
    • Health & Ecosystems
    • Culture & Policy
    • Education & Careers
    • Opinions
  • Projects
    • Postcards From the Field
    • ENGAGE
    • Editors’ Highlights
    • Editors’ Vox
    • Eos en Español
    • Eos 简体中文版
    • Print Archive: 2015–2025
  • Science Policy Tracker
  • Blogs
    • Research & Developments
    • The Landslide Blog
  • Newsletter
  • Submit to Eos

M. K. Savage

Two graphics showing how P-waves emitted by a virtual source traveled
Posted inEditors' Highlights

Fine-scale Structure Mapped by Body Waves Extracted from Noise

by M. K. Savage 17 June 20203 November 2021

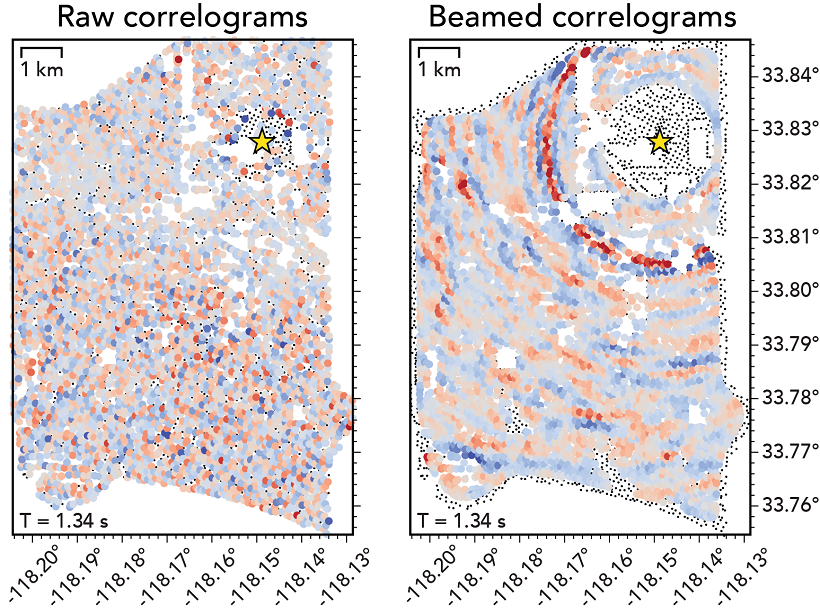
A novel processing scheme was used to extract refracted body waves from ambient seismic noise and investigate the small-scale structure around a fault at Long Beach, California.

Posted inEditors' Highlights

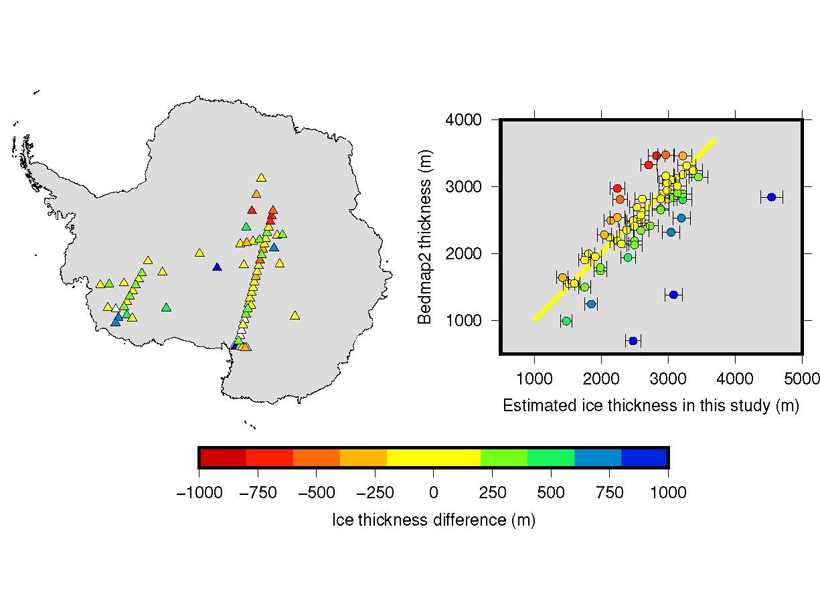
New Method to Measure Ice Cap Thickness

by M. K. Savage 21 November 20182 March 2022

Naturally generated seismic waves bouncing up and down through an ice sheet can be used to determine the thickness of the ice and monitor future changes in ice thickness.

Posted inEditors' Highlights

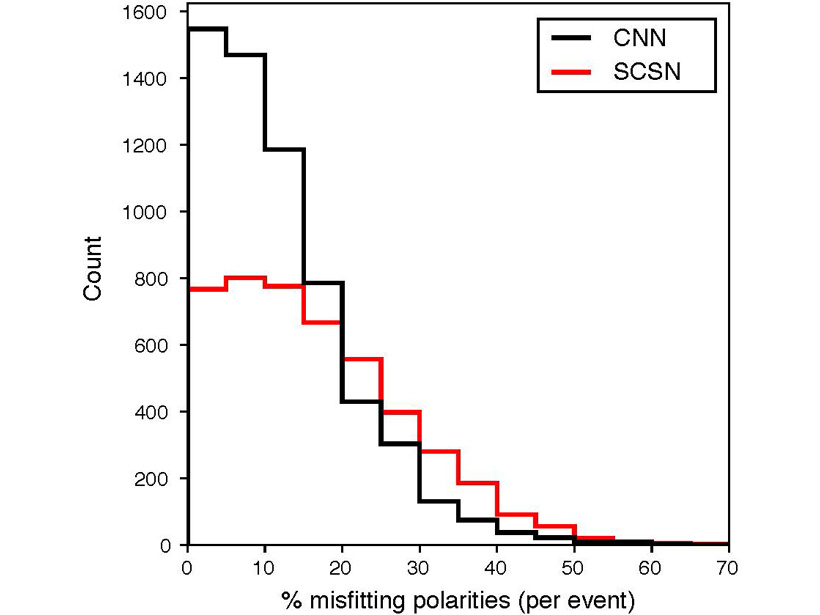
Removing the Drudgery from Earthquake Seismology

by M. K. Savage 26 July 201813 January 2022

New methods of machine learning are bringing the phase arrival time and polarity picking used for automatic determination of earthquake fault planes to accuracies better than human analysists.

Posted inEditors' Highlights

Basement Structure Mapped by Phase Autocorrelations of Noise

by M. K. Savage 9 July 201813 January 2022

Cross-correlations of ambient seismic noise are combined with well log data to image shallow crustal basement features in the Ebro Basin in Spain.

A view of a bridge, with the New Orleans skyline visible in the distance between the bridge and the water. A purple tint, a teal curved line representing a river, and the text “#AGU25 coverage from Eos” overlie the photo.

Features from AGU Publications

Research Spotlights

Denitrification Looks Different in Rivers Versus Streams

16 January 202616 January 2026
Editors' Highlights

ALMA’s New View of the Solar System

16 January 202616 January 2026
Editors' Vox

Bridging the Gap: Transforming Reliable Climate Data into Climate Policy

16 January 202616 January 2026
Eos logo at left; AGU logo at right

About Eos
ENGAGE
Awards
Contact

Advertise
Submit
Career Center
Sitemap

© 2026 American Geophysical Union. All rights reserved Powered by Newspack