
A new study examines the effects of spatiotemporal precipitation uncertainty on key hydrologic processes, including runoff and soil moisture, in a comprehensive sample of 289 cryosphere regions.
Editors’ Highlights
Posted inEditors' Highlights
Illuminating the Complex Structural Fabric Beneath the European Alps
A new study investigates the dynamics of the complex continental collision that formed the European Alps and reveals how structural alignments change with depth.

Posted inEditors' Highlights
Earthquakes Have Preparatory Stage Years Before Rupture
Tidally induced seismicity increased locally before the 2019 Ridgecrest earthquake, suggesting that fault sensitivity to stress increases in the years immediately before large earthquakes.
Posted inEditors' Highlights
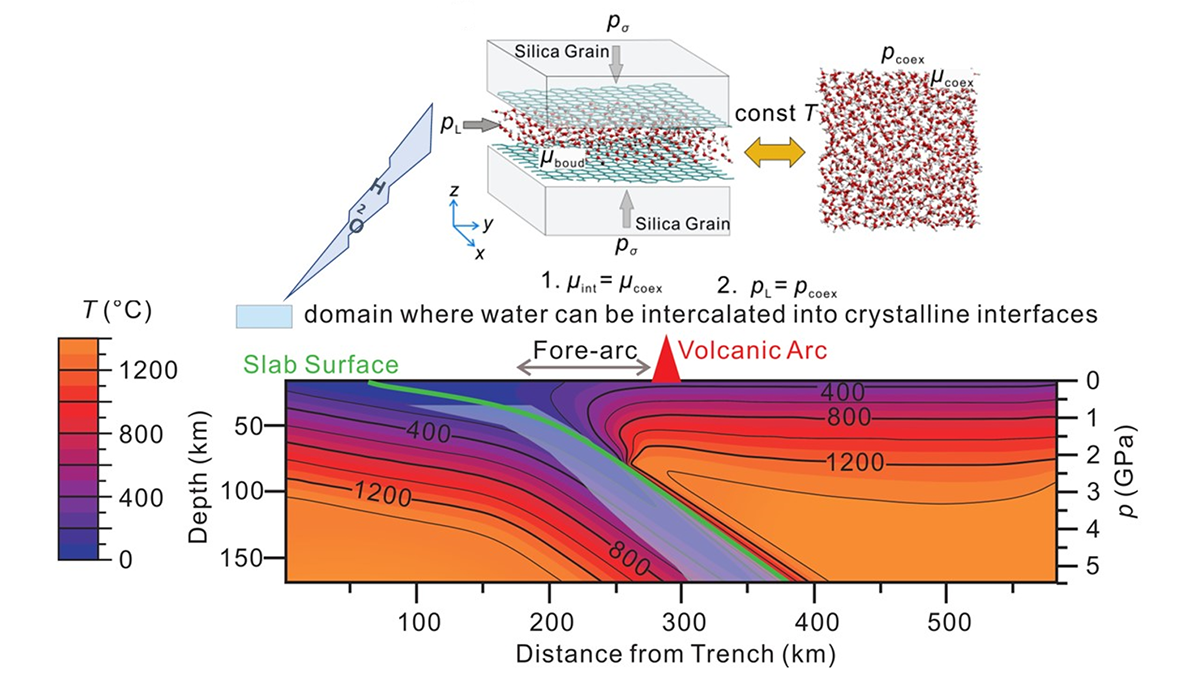
Fluid Release from Subducted Slabs Without Percolation Flow
A new study demonstrates the absorption mechanism of H2O release out of subducting slabs, making the previous hypothesis of dehydration embrittlement unnecessary.
Posted inEditors' Highlights
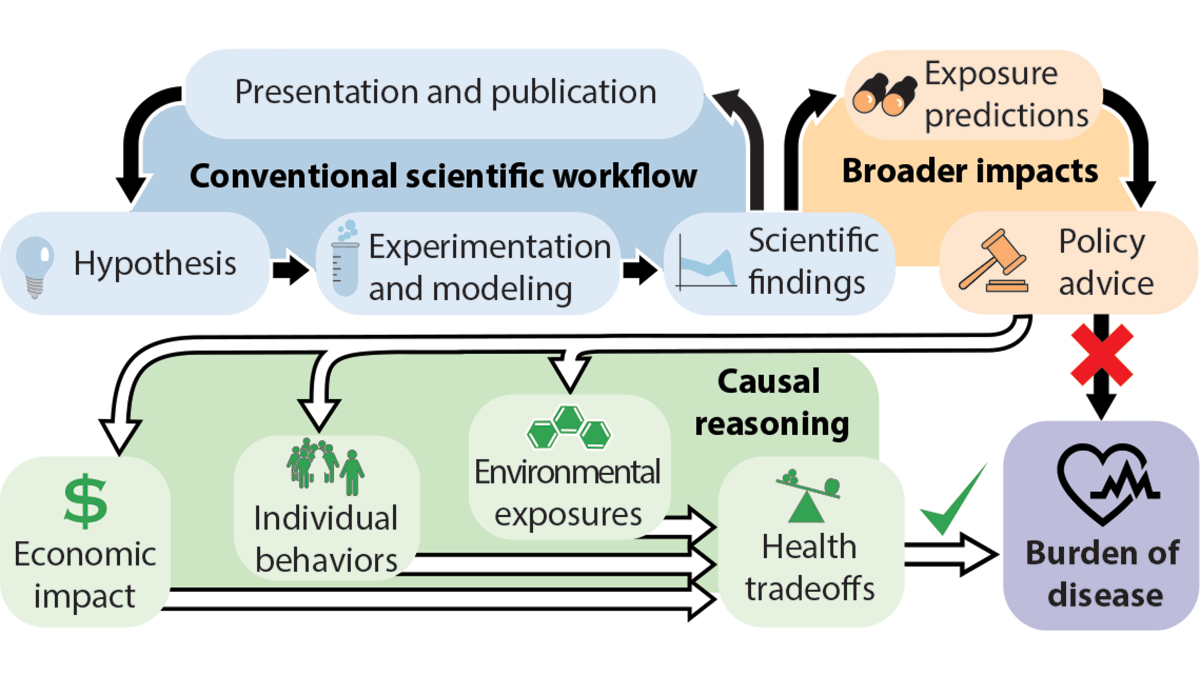
Connecting the Dots Between Geohealth Research and Health Policy
Geohealth research is typically focused on environment-health impacts, but including physical and social mechanisms, and health and non-health trade-offs, can result in better policy benefits.
Posted inEditors' Highlights
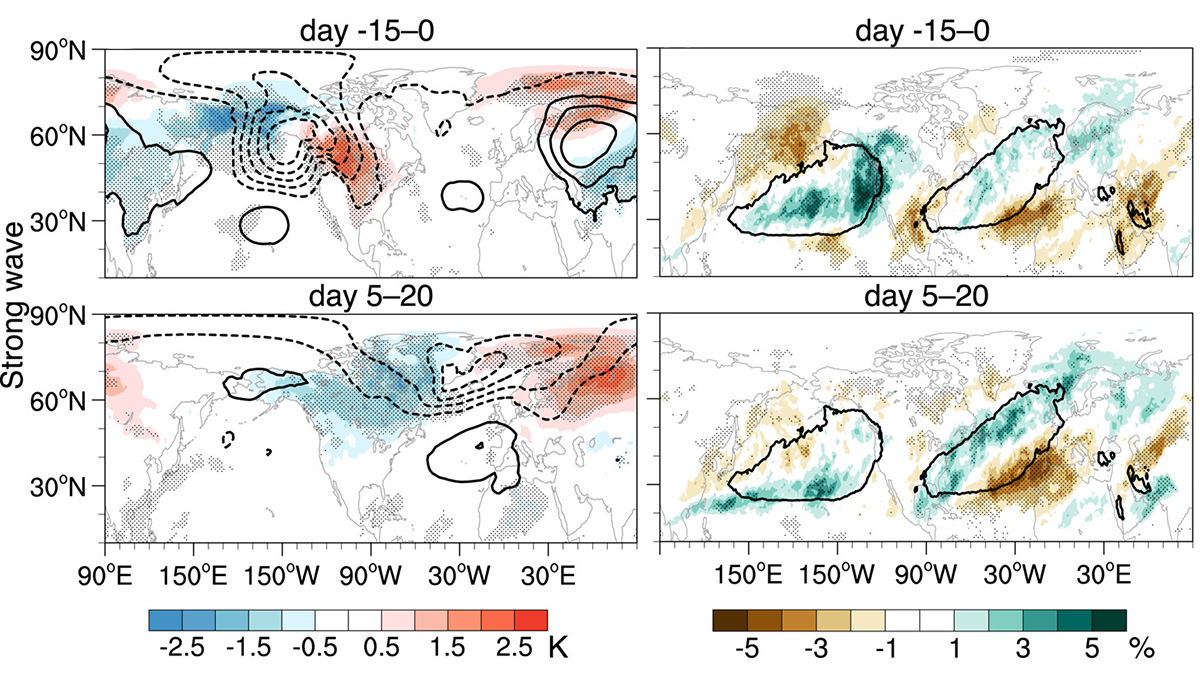
Modeling Stratospheric Impacts on North American Extreme Events
A new study quantifies the tropospheric and surface impacts of extreme stratospheric wave events and evaluates their representation in state-of-the-art climate models.
Posted inEditors' Highlights
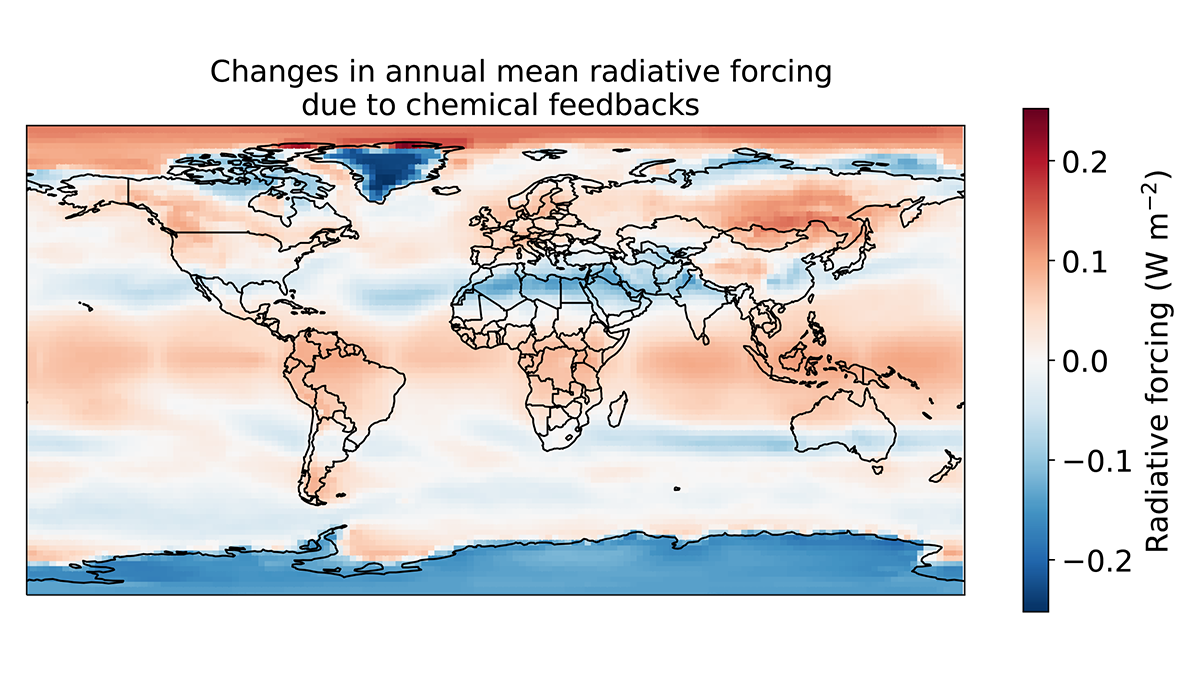
Unexpected Consequences of Solar Geoengineering
Solar engineering is not a substitute for mitigation, and concerns about its risks and unintended impacts are supported by the recent discovery of overlooked atmospheric chemical feedback.

Posted inEditors' Highlights
Observing the Impact of Convective Aggregation on Water Vapor
Remote sensing measurements for water vapor isotopic composition enable us to assess how convective aggregation influences the atmospheric hydrological cycle.
Posted inEditors' Highlights
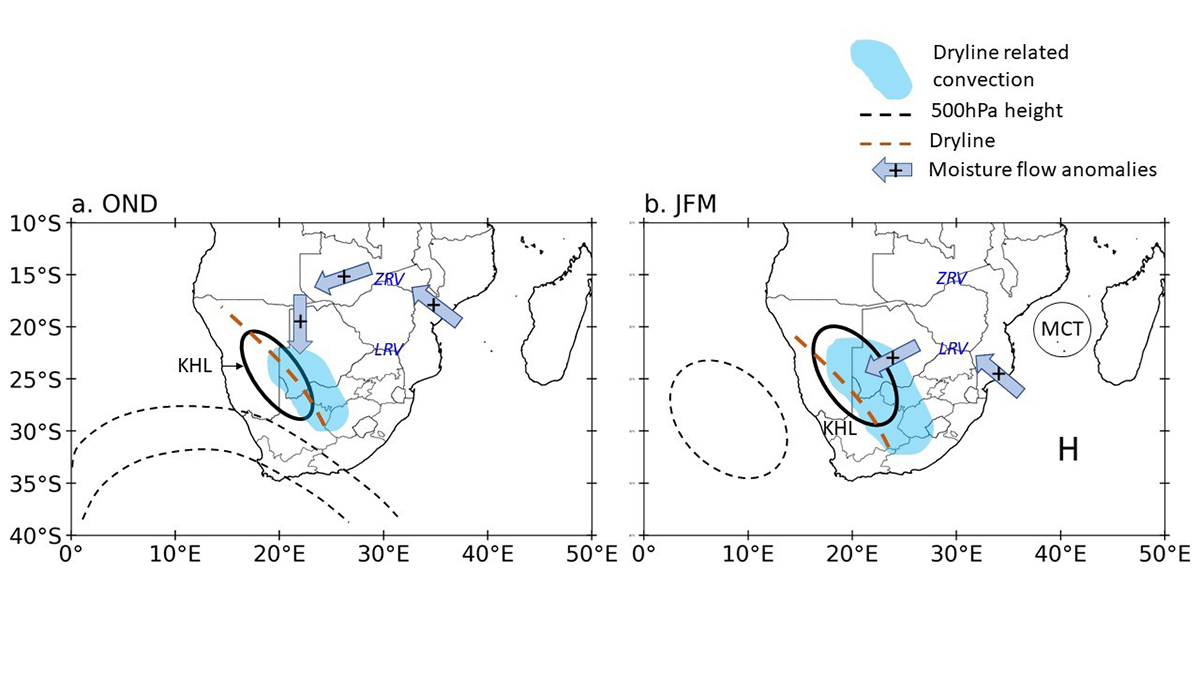
Dryline-Induced Thunderstorms Over the Southern Africa Plateau
Scientists present the first comprehensive study of dryline formation and associated thunderstorms over the southern African plateau from 2010 to 2021.

Posted inEditors' Highlights
Northern Ecosystems are Shaped by Snow
Changing climate in the Arctic leads to a shorter snow season but deeper snow in the depths of winter. Under the insulating snow, biological processes are accelerated leading to higher nutrient availability and carbon losses.