• About
  • Special Reports
  • Topics
    • Climate
    • Earth Science
    • Oceans
    • Space & Planets
    • Health & Ecosystems
    • Culture & Policy
    • Education & Careers
    • Opinions
  • Projects
    • Postcards From the Field
    • ENGAGE
    • Editors’ Highlights
    • Editors’ Vox
    • Eos en Español
    • Eos 简体中文版
    • Print Archive: 2015–2025
  • Policy Tracker
  • Blogs
    • Research & Developments
    • The Landslide Blog
  • Newsletter
  • Submit to Eos
  • AGU.org
  • Career Center
  • Join AGU
  • Give to AGU
  • About
  • Special Reports
  • Topics
    • Climate
    • Earth Science
    • Oceans
    • Space & Planets
    • Health & Ecosystems
    • Culture & Policy
    • Education & Careers
    • Opinions
  • Projects
    • Postcards From the Field
    • ENGAGE
    • Editors’ Highlights
    • Editors’ Vox
    • Eos en Español
    • Eos 简体中文版
    • Print Archive: 2015–2025
  • Policy Tracker
  • Blogs
    • Research & Developments
    • The Landslide Blog
  • Newsletter
  • Submit to Eos
Skip to content
  • AGU.org
  • Career Center
  • Join AGU
  • Give to AGU
Eos

Eos

Science News by AGU

Support Eos
Sign Up for Newsletter
  • About
  • Special Reports
  • Topics
    • Climate
    • Earth Science
    • Oceans
    • Space & Planets
    • Health & Ecosystems
    • Culture & Policy
    • Education & Careers
    • Opinions
  • Projects
    • Postcards From the Field
    • ENGAGE
    • Editors’ Highlights
    • Editors’ Vox
    • Eos en Español
    • Eos 简体中文版
    • Print Archive: 2015–2025
  • Policy Tracker
  • Blogs
    • Research & Developments
    • The Landslide Blog
  • Newsletter
  • Submit to Eos

Editors’ Highlights

A diagram and a graph showing how ocean island eruptions are much more likely to exhibit SO2 degassing and deformation.
Posted inEditors' Highlights

Why Do Arc Volcanoes Deform Less Than Ocean Island Volcanoes?

by Paul Asimow 15 August 202215 November 2022

Volcanic ground deformation is not simply correlated with erupted volume. Researchers propose that high concentrations of magmatic volatiles make systems more compressible and suppress deformation.

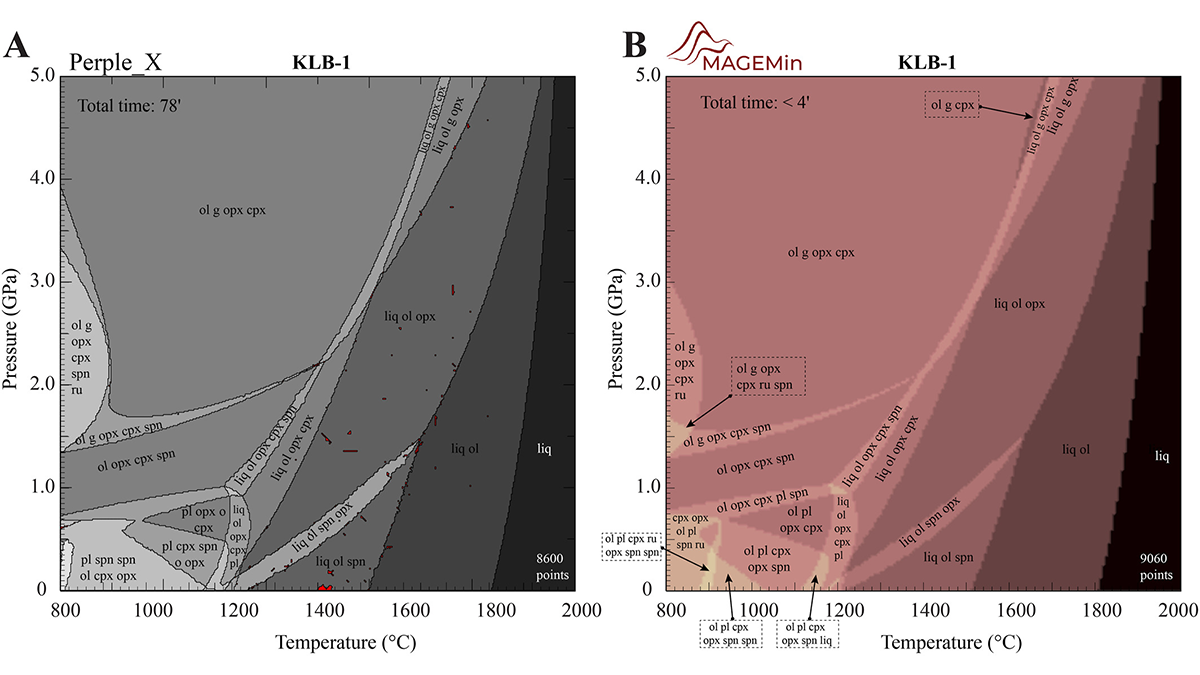
Two phase diagrams calculated by (a) Perple_X and (b) the new MAGEMin software.
Posted inEditors' Highlights

A New, Fast Computational Tool for Magmatic Phase Equilibria

by Paul Asimow 11 August 202222 December 2022

Thermodynamic calculations in multiphase, multicomponent magmatic systems can be slow and buggy. A new parallel architecture solves the free energy minimization problem much faster than alternatives.

Global ROTI map focusing on the Asia-Oceania sector and two graphs showing Swarm C and Swarm B paths.
Posted inEditors' Highlights

Tonga Volcanic Eruption Produced Ionospheric Hole and ‘Bubbles’

by Huixin Liu 10 August 20229 September 2022

The 2022 Tonga volcano eruption altered the global ionosphere, creating a huge ionospheric hole locally near the epicenter and large-amplitude plasma bubbles remotely over the Asia-Oceania area.
Posted inEditors' Highlights

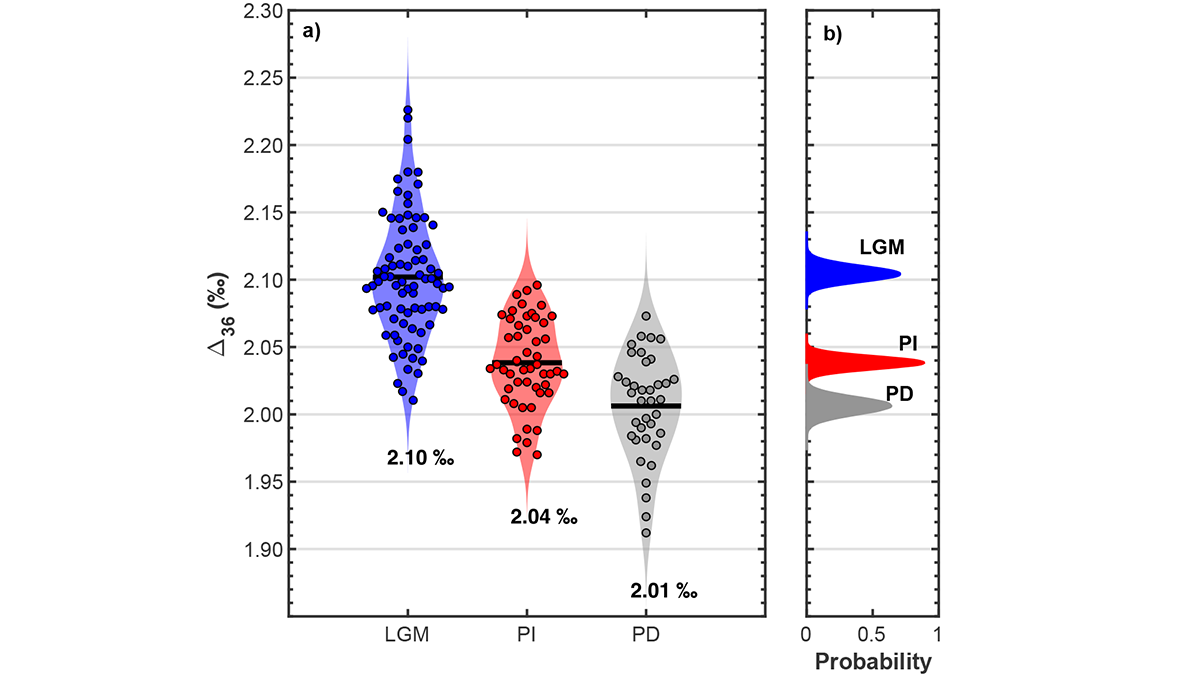
New Tool to Decipher Past Upper Troposphere Temperatures

by Susan Trumbore 9 August 20229 February 2023

Small variations in clumped O2 isotopes reflect temperatures in the upper troposphere. Bubbles measured in polar ice cores show the global lapse-rate appears to steepen during the Last Glacial Maximum.
Posted inEditors' Highlights

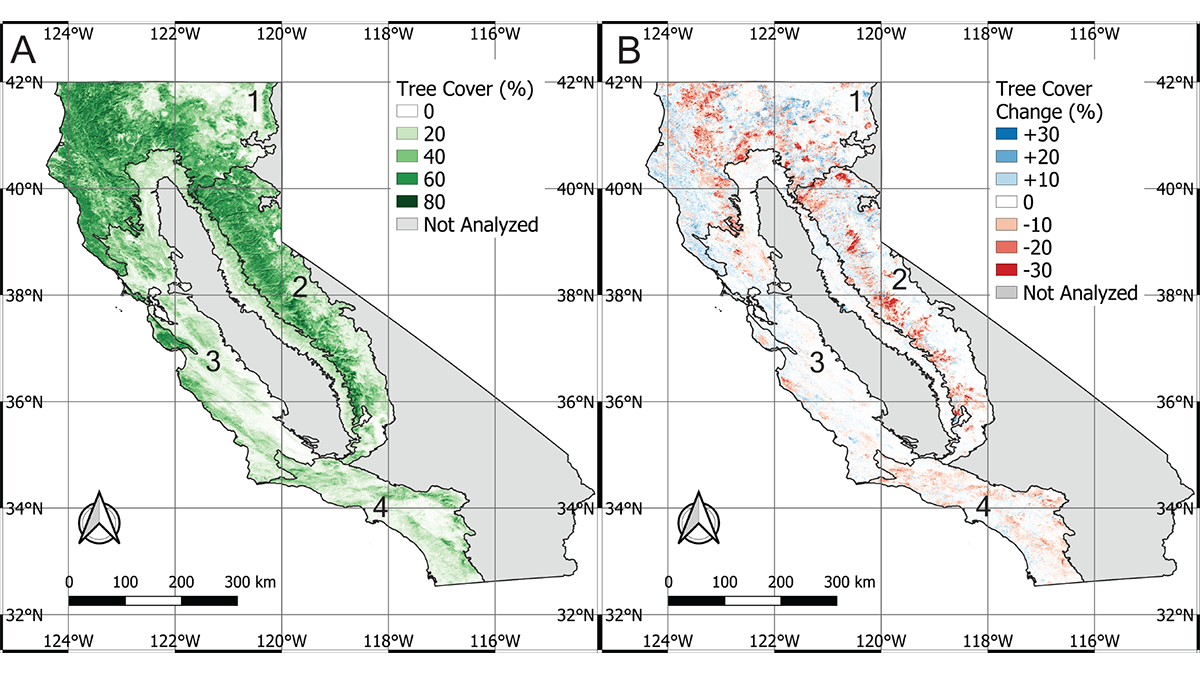
A Burning Issue

by David S. Schimel 8 August 202222 December 2022

California has lost 7% of its forest cover to climate change over the past 25 years.
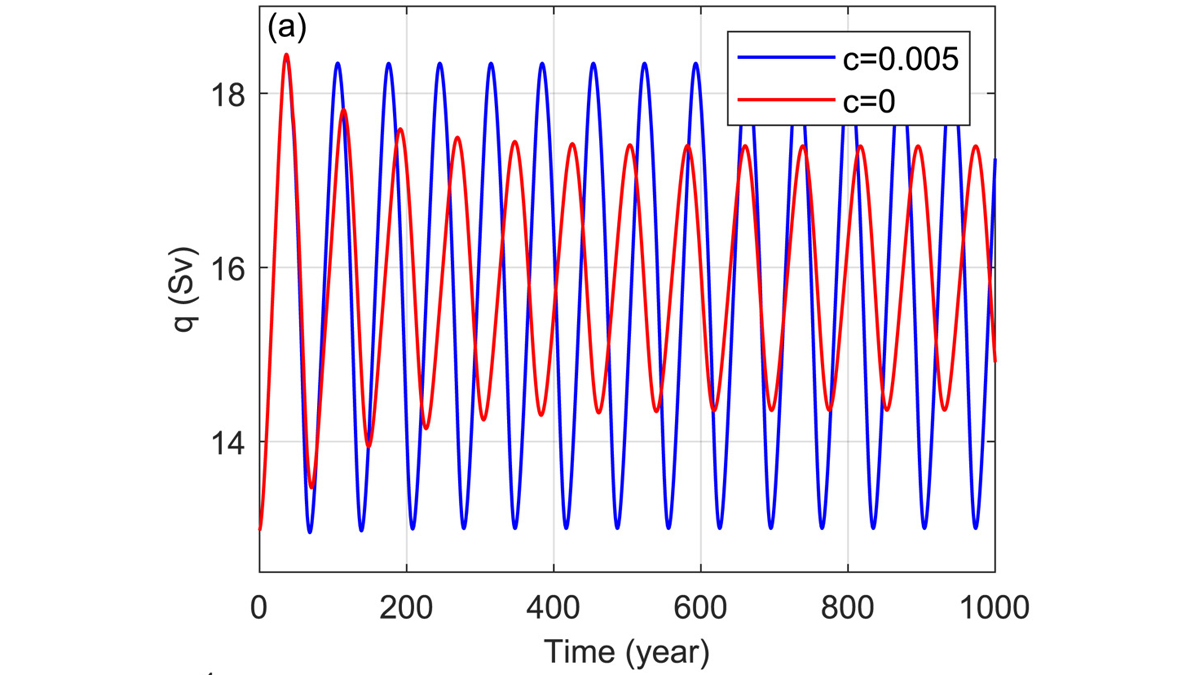
Graph from the paper.
Posted inEditors' Highlights

Arctic Salinity Pushes the AMOC Swing

by Kristopher B. Karnauskas 3 August 20222 July 2024

A model of the Atlantic Meridional Overturning Circulation (AMOC), pioneered by Henry Stommel over 60 years ago, can exhibit realistic cyclic behavior if the role of Arctic salinity is included.

Graphs showing the vertical profiles of the error in shortwave downwelling flux, upwelling flux, and heating rates computed from fluxes.
Posted inEditors' Highlights

Machine Learning Emulation of Atmospheric Radiative Transfer

by Jiwen Fan 2 August 202213 February 2023

Using machine learning to represent sub-grid processes in weather and climate models holds promise, but also faces challenges. Incorporating physical knowledge can help.
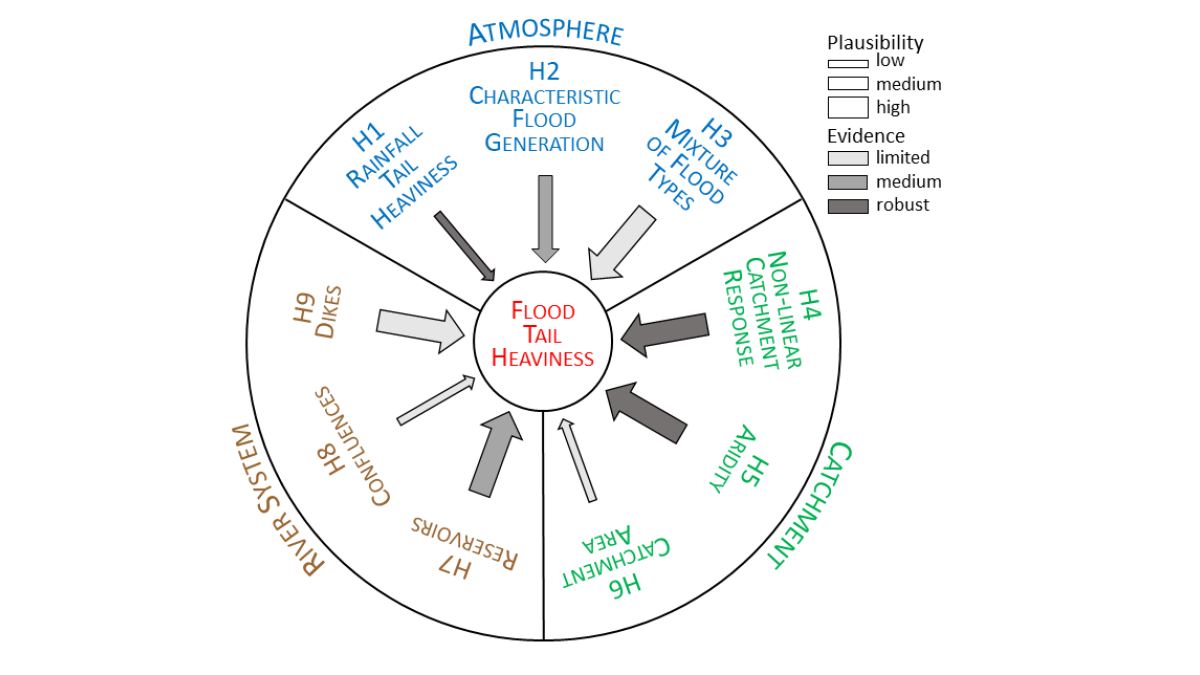
Diagram showing the nine hypotheses discussed in the paper.
Posted inEditors' Highlights

Nine Reasons Why Extreme Floods may be Worse Than Expected

by Jim Hall 1 August 20221 December 2022

The implications of nature not conforming to statistical assumptions can be devastating; researchers describe why extreme floods may be bigger than we assume.
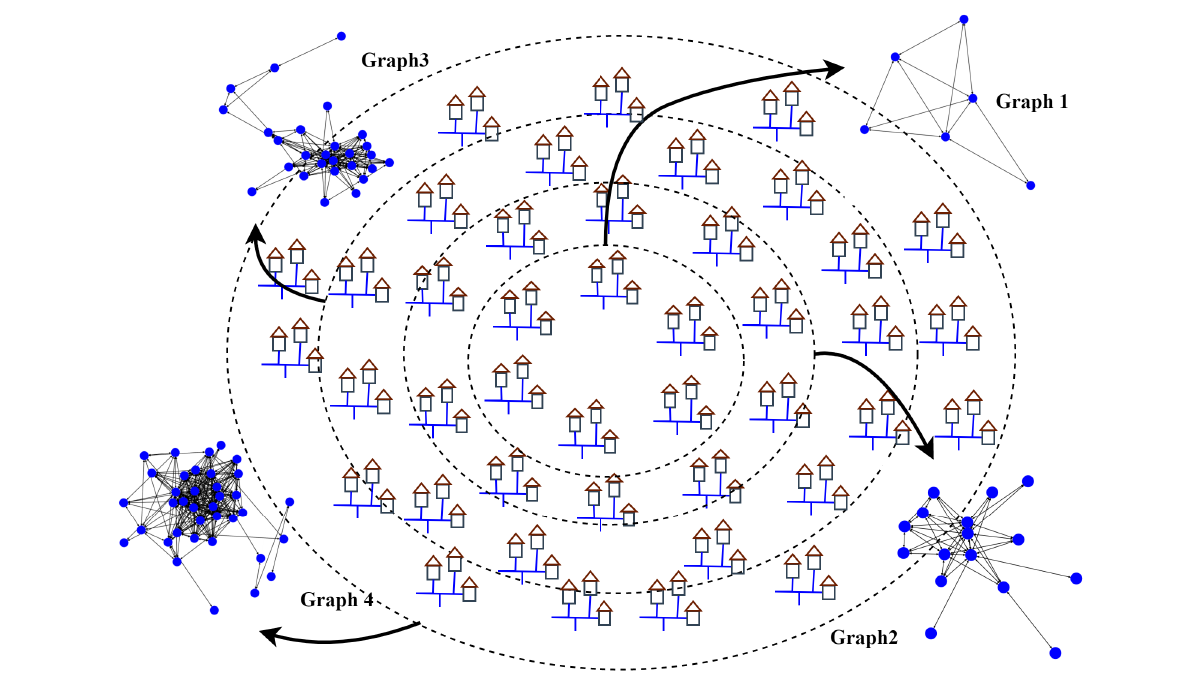
Diagram from the paper showing how the new algorithm builds graphs.
Posted inEditors' Highlights

AI Algorithm Provides More Accurate Forecasts of Water Use

by Jim Hall 29 July 202214 February 2023

The new graph convolutional recurrent neural network (GCRNN) will enable water utilities to forecast water use, even if some sensors fail.

Two maps of the study region displaying earthquake depth as colored dots.
Posted inEditors' Highlights

Aftershocks Reveal Coseismic Rupture of Megathrust Earthquakes

by Agnes Helmstetter 28 July 202221 September 2022

More accurate aftershock zones reveal that the rupture areas of megathrust Aleutian–Alaska earthquakes are larger than we thought and partly overlap, in contradiction with the seismic gap hypothesis.

Posts pagination

Newer posts 1 … 59 60 61 62 63 … 120 Older posts
Over a dark blue-green square appear the words Special Report: The State of the Science 1 Year On.

Features from AGU Publications

Research Spotlights

Preserving Soil Carbon by Preserving the Forest Floor

5 October 20265 October 2026
Editors' Highlights

New Insights into Permafrost Degradation and Subsidence

5 October 20265 October 2026
Editors' Vox

Where Fire Ends, Chemistry Begins

30 September 202630 September 2026
Eos logo at left; AGU logo at right

About Eos
ENGAGE
Awards
Contact

Advertise
Submit
Career Center
Sitemap

© 2026 American Geophysical Union. All rights reserved Powered by Newspack