• About
  • Sections
  • Topics
    • Climate
    • Earth Science
    • Oceans
    • Space & Planets
    • Health & Ecosystems
    • Culture & Policy
    • Education & Careers
    • Opinions
  • Projects
    • ENGAGE
    • Editors’ Highlights
    • Editors’ Vox
    • Eos en Español
    • Eos 简体中文版
    • Print Archive
  • Blogs
    • Research & Developments
    • The Landslide Blog
  • Newsletter
  • Submit to Eos
  • AGU.org
  • Career Center
  • Join AGU
  • Give to AGU
  • About
  • Sections
  • Topics
    • Climate
    • Earth Science
    • Oceans
    • Space & Planets
    • Health & Ecosystems
    • Culture & Policy
    • Education & Careers
    • Opinions
  • Projects
    • ENGAGE
    • Editors’ Highlights
    • Editors’ Vox
    • Eos en Español
    • Eos 简体中文版
    • Print Archive
  • Blogs
    • Research & Developments
    • The Landslide Blog
  • Newsletter
  • Submit to Eos
Skip to content
  • AGU.org
  • Career Center
  • Join AGU
  • Give to AGU
Eos

Eos

Science News by AGU

Support Eos
Sign Up for Newsletter
  • About
  • Sections
  • Topics
    • Climate
    • Earth Science
    • Oceans
    • Space & Planets
    • Health & Ecosystems
    • Culture & Policy
    • Education & Careers
    • Opinions
  • Projects
    • ENGAGE
    • Editors’ Highlights
    • Editors’ Vox
    • Eos en Español
    • Eos 简体中文版
    • Print Archive
  • Blogs
    • Research & Developments
    • The Landslide Blog
  • Newsletter
  • Submit to Eos

Michael A. Hapgood

Editor, Space Weather

Chart showing polar cap index values for four days around the St Patrick’s Day storm of 2015.
Posted inEditors' Highlights

Watching the Substorms Grow

by Michael A. Hapgood 24 May 20222 August 2022

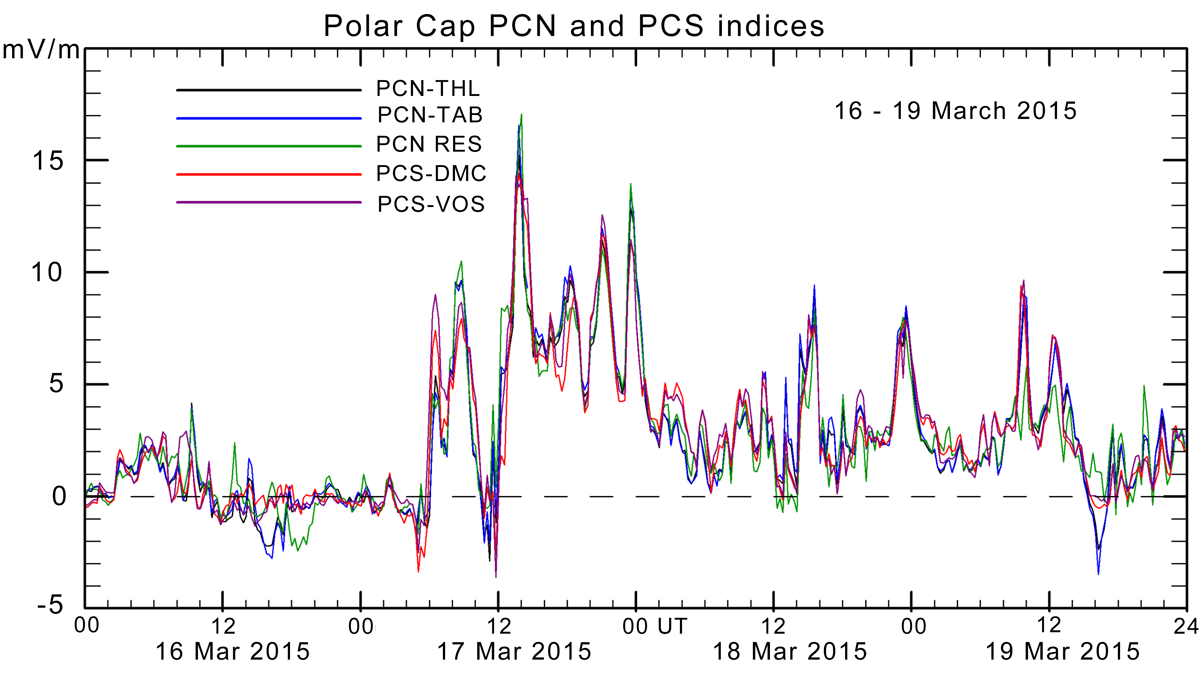
Updated procedures enable consistent use of a wide network of polar magnetometers to monitor energy flow into the tail of Earth’s magnetosphere during the growth phase of substorms.

Example of how, given the presence of aurora, an over-the-horizon radar based in Scotland might be used to track an aircraft at 10 km altitude in a region to the north.
Posted inEditors' Highlights

Can Aurora Enhance Radar Monitoring of Arctic Aviation?

by Michael A. Hapgood 2 February 202215 March 2022

Enhanced E-region ionization produced by the aurora can be used to reflect signals from over-the-horizon radars and thus enable those radars to better monitor aviation in Arctic regions.

Plot showing normalized neutron rates recorded during the space weather events in September 2017.
Posted inEditors' Highlights

Looking Down to See Upwards

by Michael A. Hapgood 24 August 202113 October 2021

Hydrological observations of cosmic ray neutrons scattered by water in soil can also provide information on space weather events such as Forbush decreases and ground level enhancements.

A graphical assessment of solar energetic particle forecasts
Posted inEditors' Highlights

How to Assess the Quality of Space Weather Forecasts?

by Michael A. Hapgood 27 May 202122 February 2023

The assessment of space weather event forecasts would benefit from more nuanced approaches that take account of event intensities peaking near the thresholds used to identify such events.

Plot showing modelled radiation exposures for aircrew and passengers on seventy Paris to New York flight paths if a severe radiation storm had started four hours after take-off of each flight.
Posted inEditors' Highlights

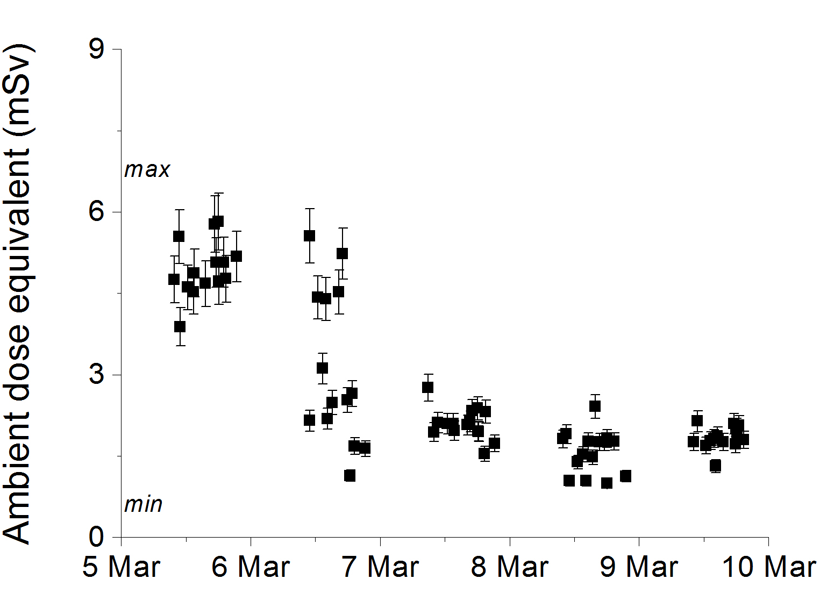
Severe Radiation Storms Pose Health Risk to Air Travel

by Michael A. Hapgood 21 May 20212 February 2022

Simulations of radiation storm fluxes on real flight paths highlight how severe space weather could expose aircrew and passengers on busy transatlantic routes to significant radiation doses.

Plot showing an example of errors in estimates of thermospheric density derived using a range of different models.
Posted inEditors' Highlights

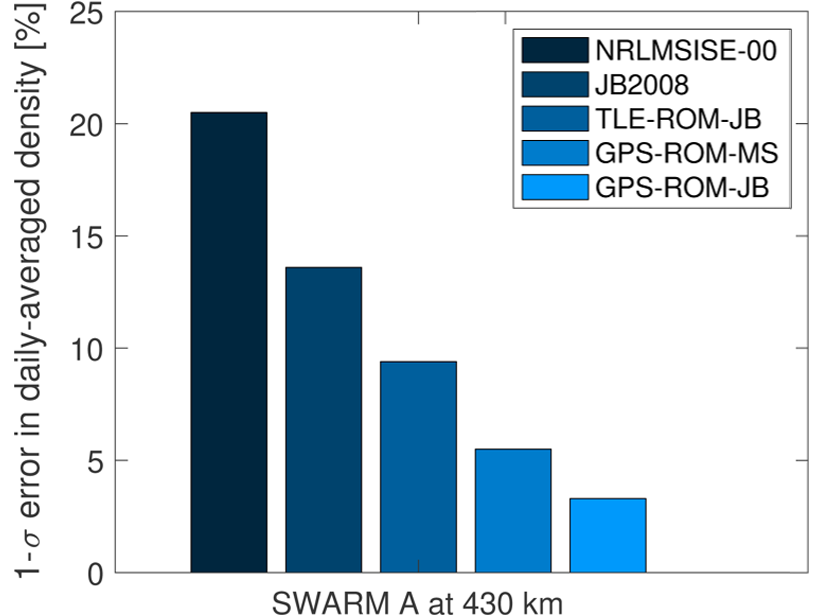
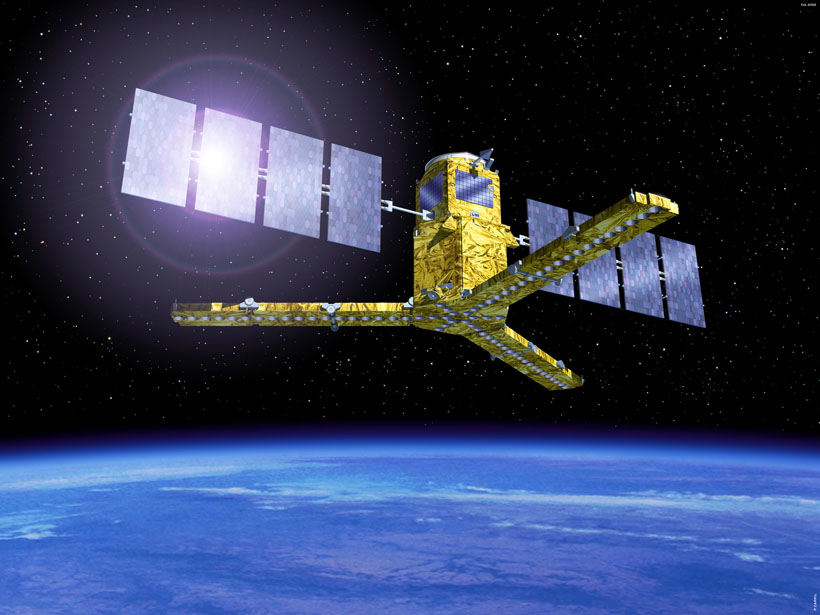
Better Thermospheric Monitoring is Vital to Space Safety

by Michael A. Hapgood 18 May 202127 July 2022

Better real-time estimates of thermospheric density are vital to the safe management of satellite traffic in Low Earth orbit, ensuring those satellites continue to deliver critical services.

Artist’s view of the SMOS satellite in orbit
Posted inEditors' Highlights

Observing the Sun via Soil Moisture Measurements

by Michael A. Hapgood 31 March 202113 October 2021

Solar radio bursts are background noise for satellite-based radio observations that monitor soil moisture, so, with appropriate processing, those observations can provide data on radio bursts.

Right: Image of a solar flare observed on 19 October 2014. Left: Diagram showing configuration of the planets at the time of the flare
Posted inEditors' Highlights

The Importance of Solar Lyman-alpha Emissions for Space Weather

by Michael A. Hapgood 29 September 202013 October 2022

Lyman-alpha emissions convey a major part of the solar-flare photon energy reaching Earth and play a significant role in flare-driven enhancements of ionospheric conductivity.

Two charts showing simulated geoelectric fields along a profile running south-east to north-west through New York City
Posted inEditors' Highlights

Is Space Weather Worse by the Sea?

by Michael A. Hapgood 29 June 202028 March 2023

A new simulation of space-weather driven geoelectric fields at the land/sea conductivity boundary shows how these fields are magnified by both coastal effects and inhomogeneous land conductivity.

Schematic of an ensemble forecast where the lines represent trajectories of individual forecasts that diverge from each other owing to uncertainties in the initial conditions
Posted inEditors' Highlights

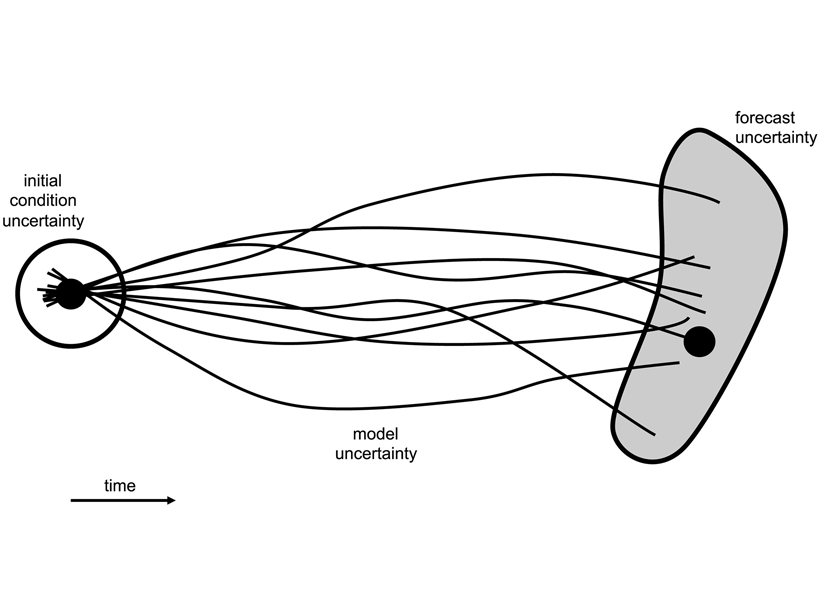
Advancing Ensemble Methods in Space Weather Forecasting

by Michael A. Hapgood 23 June 202010 February 2023

A short, must-read, report for anyone developing new space weather forecasts.

Posts pagination

1 2 3 Older posts
A view of a Washington, D.C., skyline from the Potomac River at night. The Lincoln Memorial (at left) and the Washington Monument (at right) are lit against a purple sky. Over the water of the Potomac appear the text “#AGU24 coverage from Eos.”

Features from AGU Publications

Research Spotlights

Storm Prediction Gets 10 Times Faster Thanks to AI

20 May 202520 May 2025
Editors' Highlights

Inferring River Discharge from Google Earth Images

20 May 202515 May 2025
Editors' Vox

Decoding Crop Evapotranspiration

6 May 20256 May 2025
Eos logo at left; AGU logo at right

About Eos
ENGAGE
Awards
Contact

Advertise
Submit
Career Center
Sitemap

© 2025 American Geophysical Union. All rights reserved Powered by Newspack