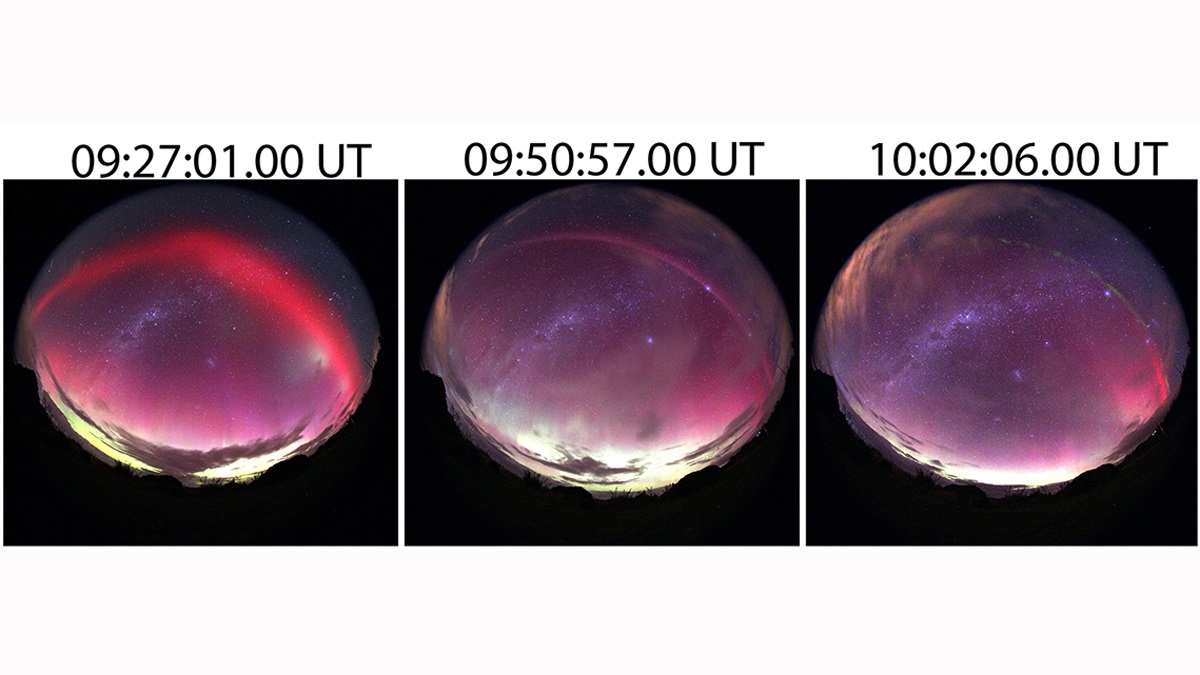
Scientists present the first direct observations on the rapid evolution of a bright red auroral arc into a thin white-mauve arc known as STEVE.
Editors’ Highlights
Posted inEditors' Highlights
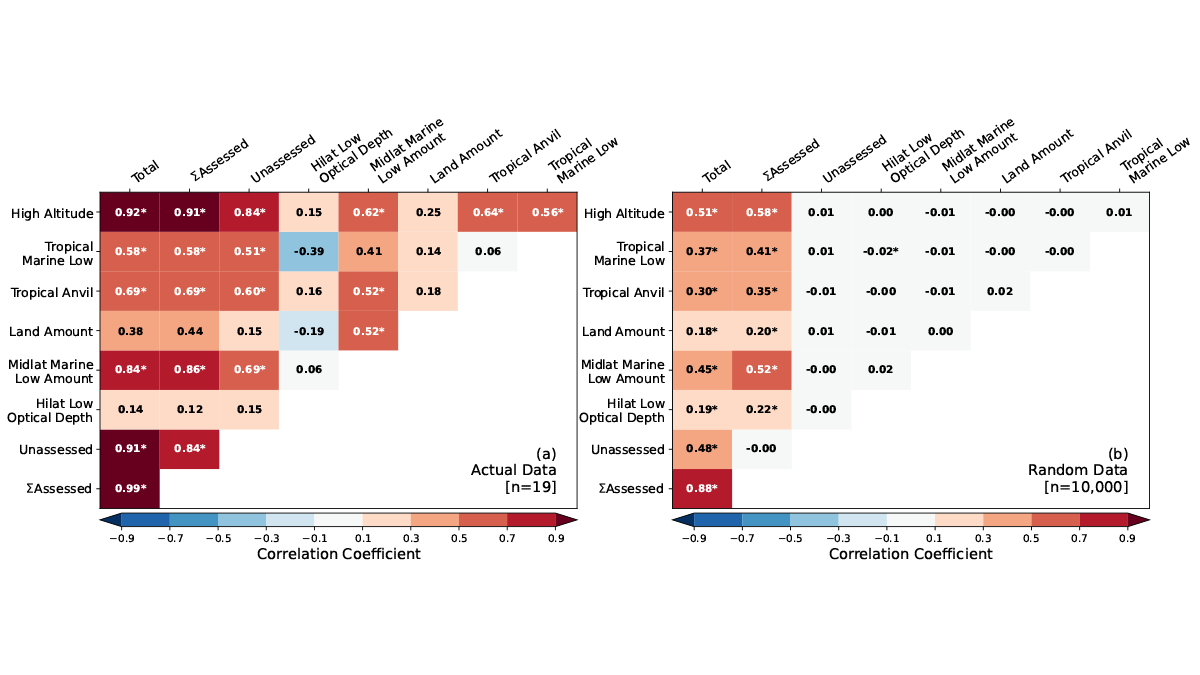
Cloud Feedbacks in CMIP6 Models Versus Expert Synthesis
Models with smallest feedback errors are found to have moderate cloud feedbacks and equilibrium climate sensitivity of 3 to 4 degrees of warming when the concentration of carbon dioxide is doubled.
Posted inEditors' Highlights
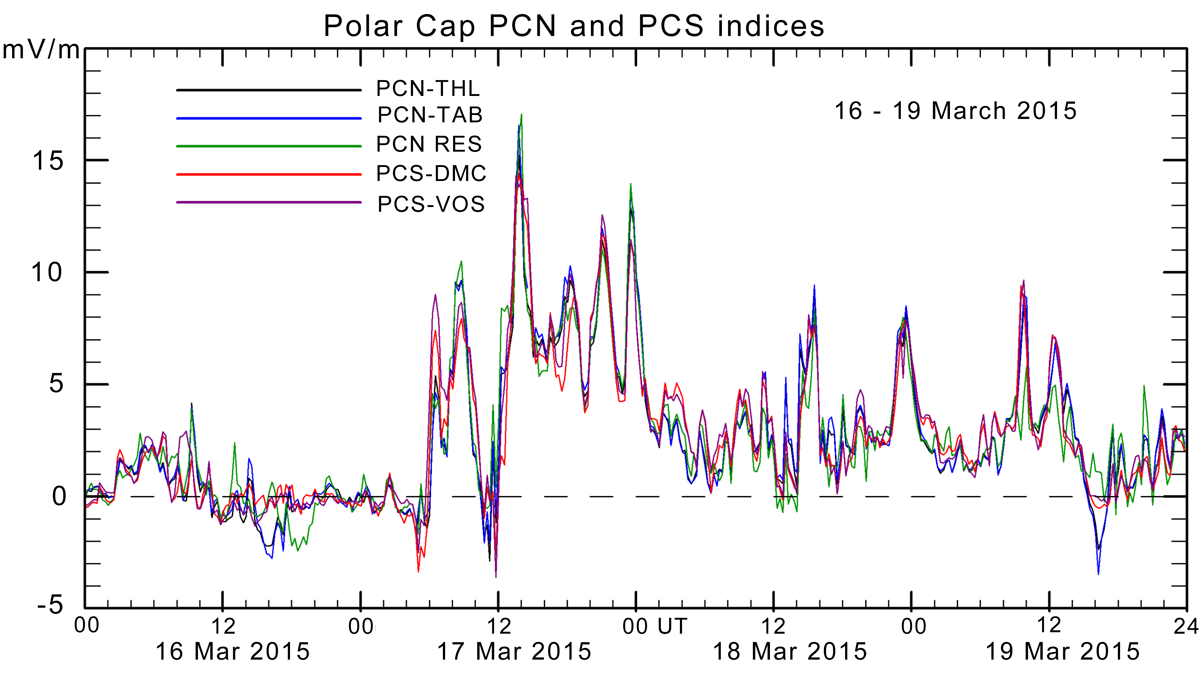
Watching the Substorms Grow
Updated procedures enable consistent use of a wide network of polar magnetometers to monitor energy flow into the tail of Earth’s magnetosphere during the growth phase of substorms.
Posted inEditors' Highlights
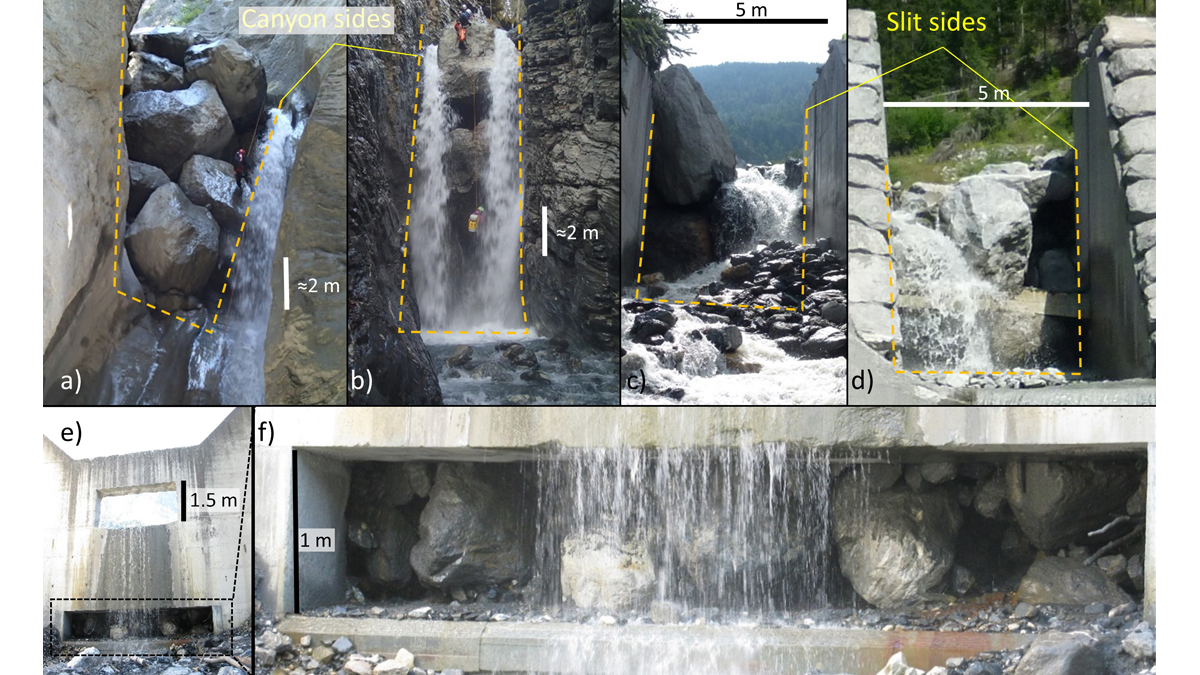
Good or Bad Jam? Modeling Boulders’ Fate at Constrictions
A new modeling framework to assess the likelihood of jamming at constrictions can be used to support the design of effective mitigation measures and reduce risk in debris flow prone areas.
Posted inEditors' Highlights
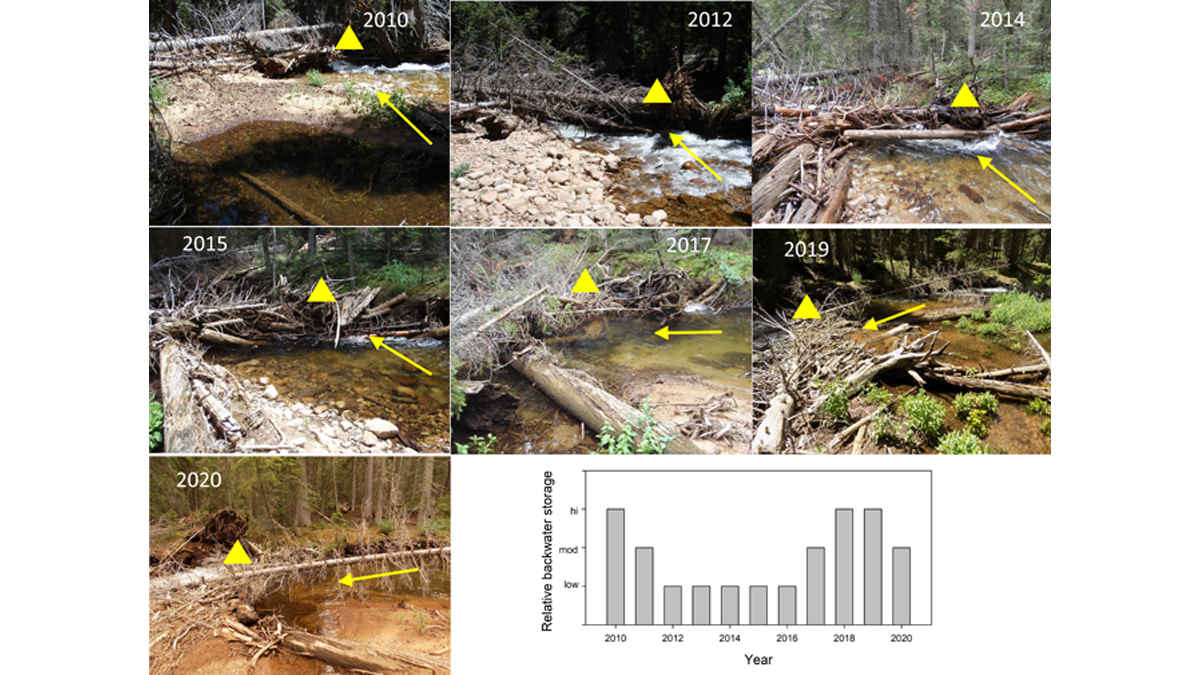
Logjams May Be Transient but Their Effect is Long Lasting
Even though natural logjams in rivers continuously change and maybe short-lived, their effects in terms of geomorphic diversity and habitat can be surprisingly long-lasting.
Posted inEditors' Highlights
Mesurer les oscillations d’un lac de lave depuis l’espace
Les images satellite permettent de mesurer les oscillations du lac de lave du Nyiragongo (RD Congo). Ces mesures renseignent sur la dynamique du volcan et aident à anticiper ses éruptions futures.

Posted inEditors' Highlights
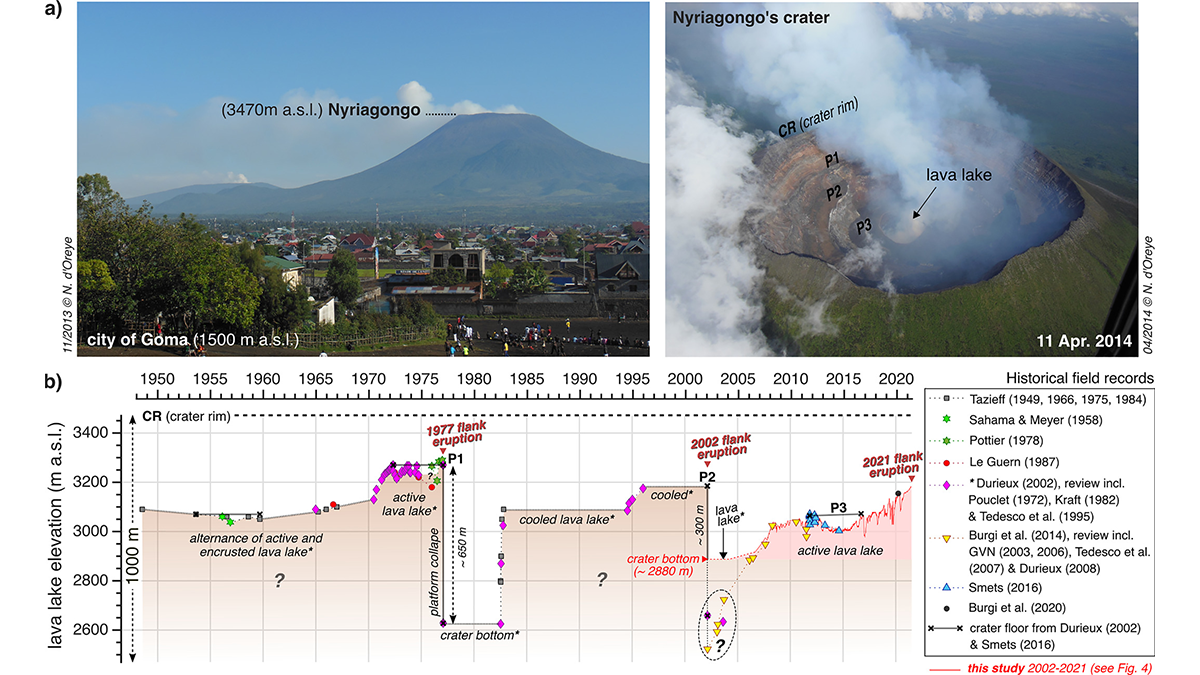
Tracking Lava Lake Levels at an African Volcano from Space
Satellite data from Nyiragongo Volcano, Democratic Republic of Congo, track changes in summit-crater lava levels that provide a window into eruption dynamics and aid in forecasting future activity.
Posted inEditors' Highlights
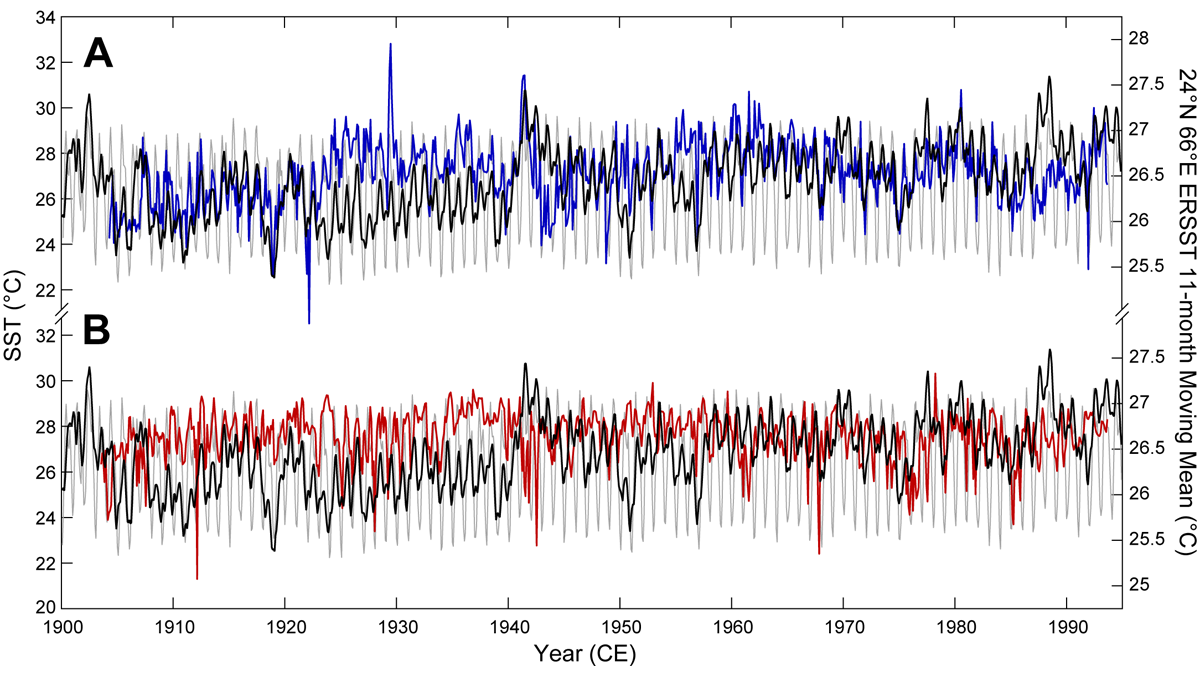
Unlocking Ultra-High-Resolution Paleothermometry from Sediments
Mass spectrometric imaging techniques used to extract micron-scale organic paleothermometry signatures from Arabian Sea sediments show that they skillfully reflect observations.

Posted inEditors' Highlights
Amateur Radio Observations Help Monitor Space Weather
Amateur radio observations provide a new method for studying large-scale ionospheric disturbances and HF communication impacts, and are important applications in ionospheric space weather monitoring.

Posted inEditors' Highlights
Pushing the Limits of IR Spectra: Using Nano-FTIR on Meteorites
A new method, nano-FTIR, is used to examine microstructures and processes on grains, displaying its benefit for examining asteroid returned samples through a meteorite.