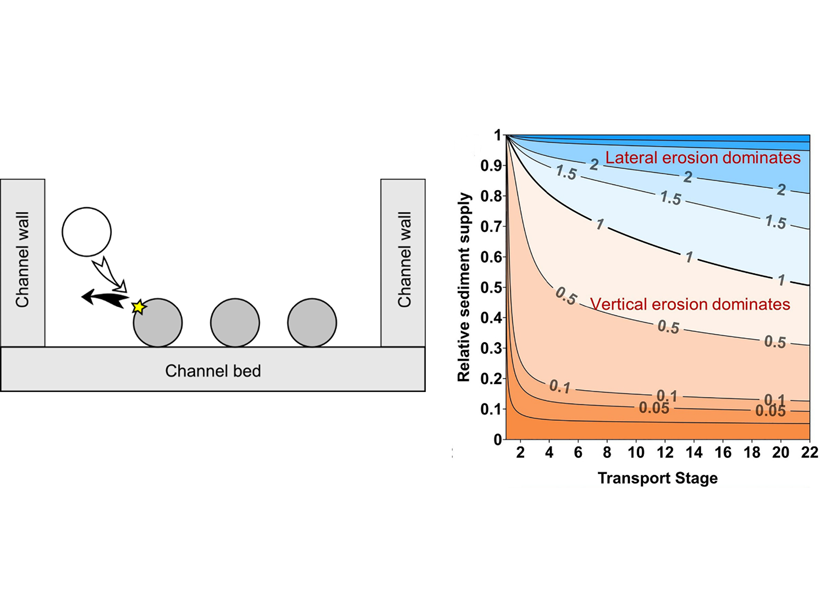
A new analytical model describes how the amount and grain size of sediment transported by rivers influences bedrock channel width, which can be used to predict where rivers will widen or narrow.
Editors’ Highlights
Posted inEditors' Highlights
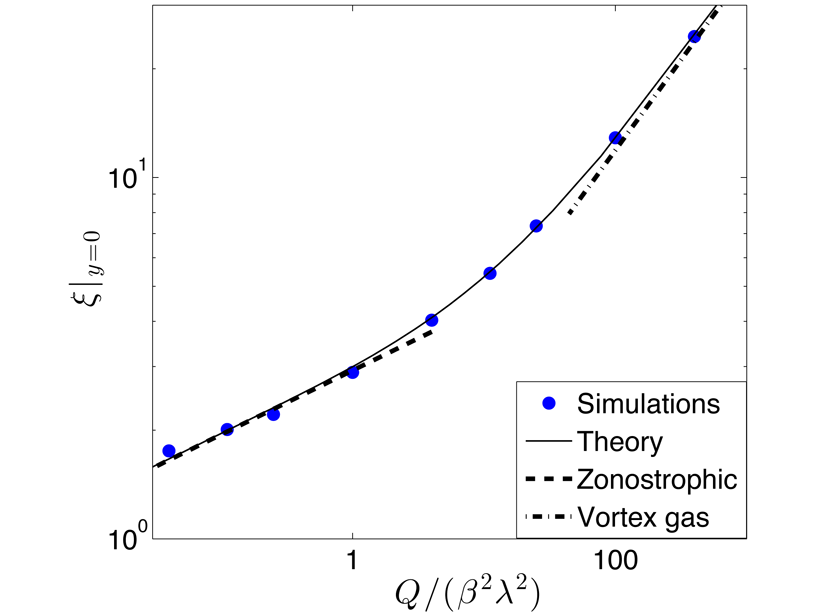
Order in Turbulence
Extracting order from turbulence is difficult, even under the most idealized conditions. A new scaling theory quantifies how eddies influence temperature gradients in geophysical turbulence.
Posted inEditors' Highlights
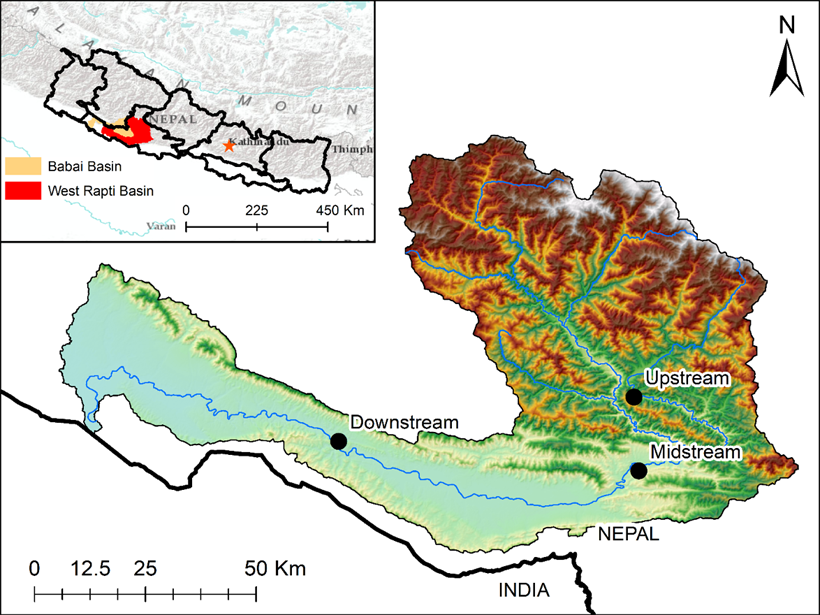
Satellite Estimates for Hydroclimatic Extremes
A new study corrects poor-performing satellite-based rainfall estimates with gauge data and also fills gauge data gaps using well-performing satellite-based rainfall estimates.
Posted inEditors' Highlights
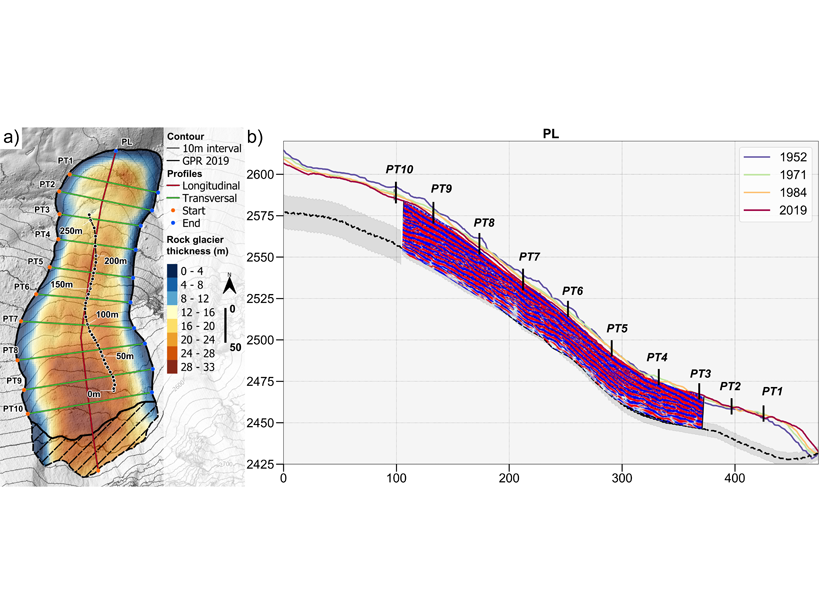
Revealing How Rock Glaciers Respond to Climate Change
Detailed measurements of the geometry and flow of Laurichard rock glacier over 67 years reveal the distinctive behavior of these landforms through periods of warming and cooling.

Posted inEditors' Highlights
A Novel Thermobarometer to Infer Mantle Melting Conditions
The algorithm RevPET automatically reverses the complex multi-phase fractional crystallization path of oceanic basalts and offers new perspectives for advancing mantle thermobarometry.
Posted inEditors' Highlights
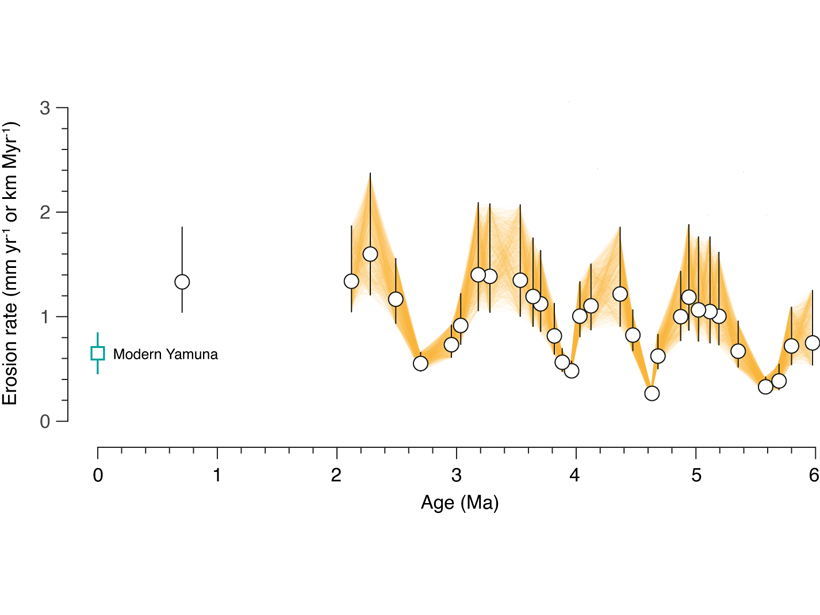
Himalayan Tectonics in the Driver’s Seat, Not Climate?
Earth’s oscillating climate is a natural guess to explain cyclic patterns in erosion, but new sediment data suggests that cyclicity may emerge from tectonic processes adding material to the Himalaya.
Posted inEditors' Highlights
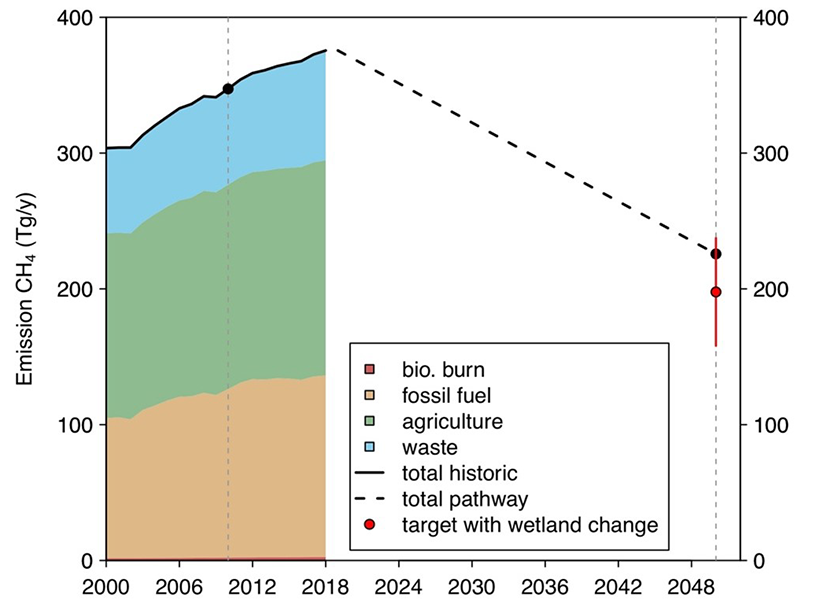
Bottom-up Meets Top-down Estimates of Wetland Methane Emissions
An innovative integration of models and satellite observations indicates weak temperature sensitivity of CH4 emissions from tropical wetlands, but temperature sensitivity is high at higher latitudes.
Posted inEditors' Highlights
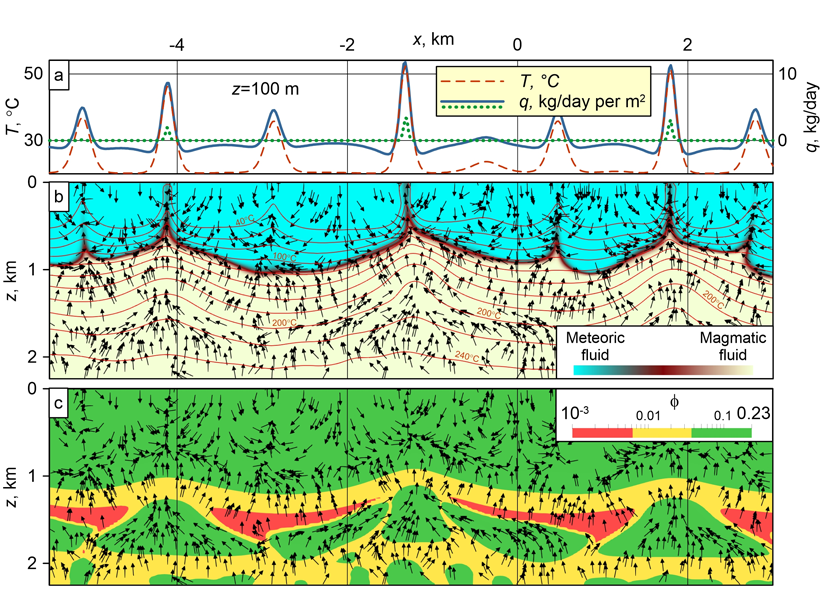
Coupled Mechanisms of Fluid Transport Across the Crust
Magmatic fluid moves up in the ductile zone through porosity waves, accumulates in high-porosity lenses, and migrates across the brittle zone in a convection pattern involving also meteoric fluid.

Posted inEditors' Highlights
Subduction Zone Earthquakes: Fast and Slow, Weak and Strong
What causes slow earthquakes in subduction zones? New insights from numerical models suggest that a mixture of strong and weak rocks might be the cause.
Posted inEditors' Highlights
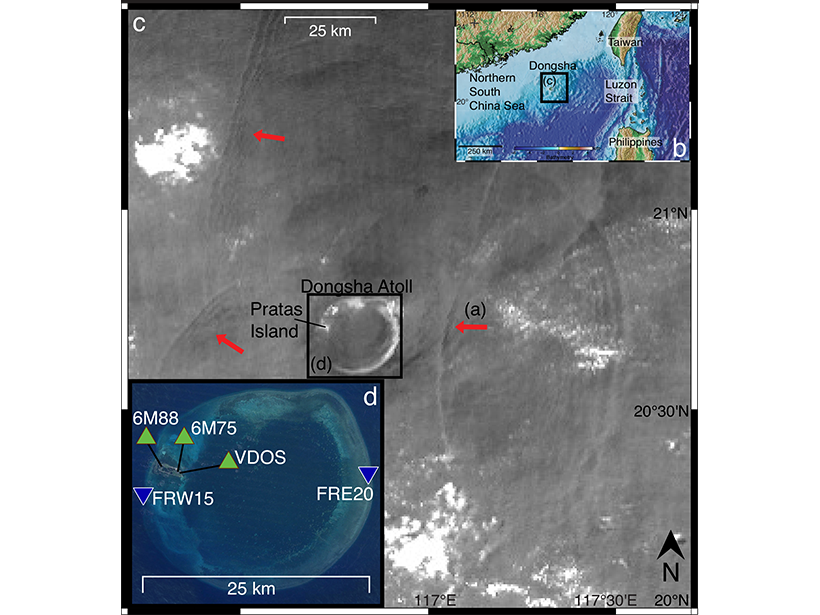
Atoll Seismometer Detection of Solitary Ocean Waves
Seismic recordings from the South China Sea indicate that subtle, daily tilting of shorelines due to passing internal ocean waves can be measured on land, promising new constraints on ocean dynamics.