The COVID-19 pandemic has changed all our lives in many ways. One specific aspect the media has been reporting on—and a topic that AGU has received a number of inquiries about—is the effect the pandemic is having on female academics. Within the AGU Publications Department, we specifically wanted to see how the pandemic is affecting our authors.
So far, we aren’t seeing statistically significant changes in submissions from women or researchers in countries most affected by the COVID-19 outbreak.
We looked at the latest data on people submitting new manuscripts to our journals in the context of historical trends. We focused on the gender, age, and geographical location of the “corresponding” author, who is typically the lead/first author and submits the article and acts as the main point of contact.
The bottom line is that, so far, we aren’t seeing statistically significant changes in submissions from women or researchers in countries most affected by the COVID-19 outbreak, but it’s worth taking a look at the data more closely.
A bit about the age and gender data: We looked at submissions to all our journals between January 2018 and April 2020. We matched corresponding authors with our AGU database of members and non-members who self-identified their birth year and gender. Of distinct corresponding authors in this analysis, 70% have identified their gender and 53% their age. Corresponding authors provide their country of physical address when submitting their manuscript. The data supporting this analysis is anonymized and provided in aggregate here.
Month-by-month
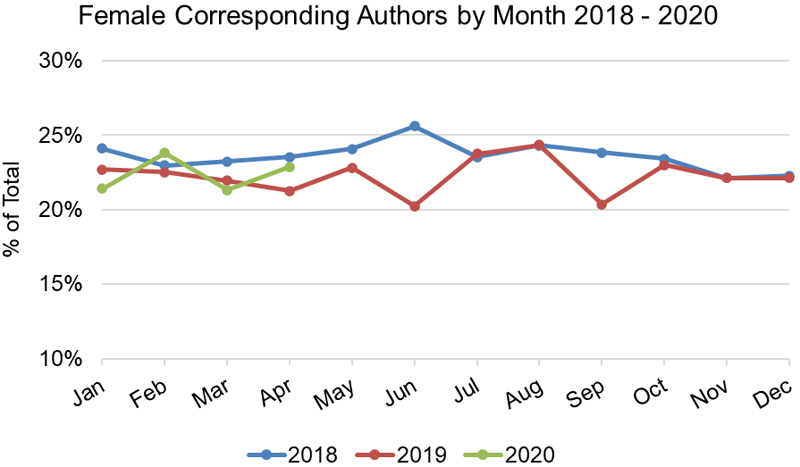
First, we compared the current year’s monthly submissions with previous years to see if there are any seasonal trends in manuscript submissions by women. The data suggest no significant trends: So far this year, we’ve only seen minor differences each month in the proportion of female corresponding authors. There is a noticeable difference between June 2018 and June 2019, so we’ll be eager to examine data of the rest of the months of 2020 once we get them.

Age group
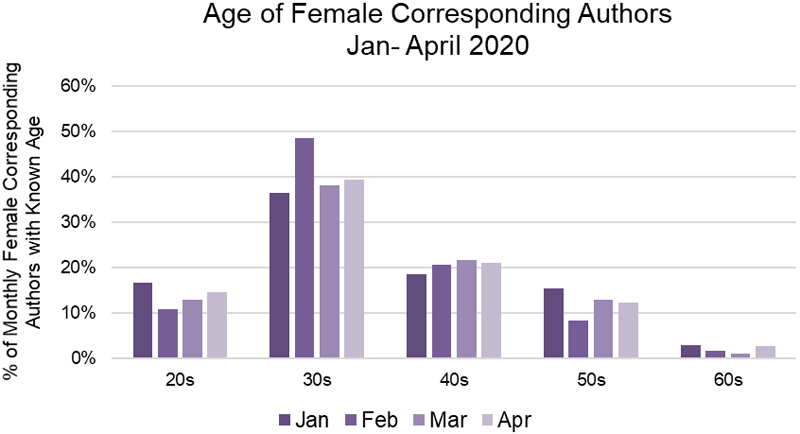
Though the dataset of corresponding authors with known age and gender is slightly smaller, it’s still worth breaking out the data by age cohort. In the first four months of 2020, the proportion of female corresponding authors in their 20s increased from February to April; women in their 30s submitting papers noticeably increased in February but dropped in March and stayed about the same in April; and women in their 40s and 50s submitted nearly the same percentage of manuscripts in April and March.

A variety of individual factors across and within age groups make it difficult to draw any immediate conclusions from the data. We’ll continue to monitor the situation with a particular focus on early career researchers as they juggle teaching (or job hunting), research, and childcare, demands only exacerbated by the pandemic.
Geographic region
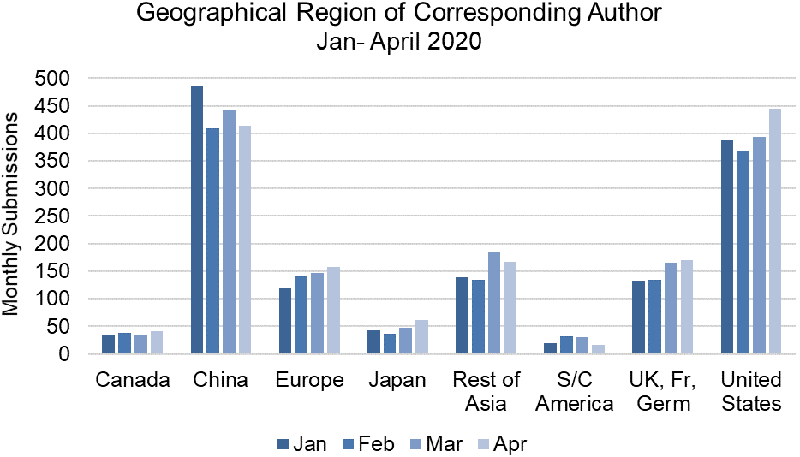
The timing of the spread of the virus and the restrictions imposed by countries have differed across the world, so how has that affected our authors from different regions? Most regions saw an increase in submissions between February and April, except China, and Central and South America. The decline in the Americas was due to decreases in Brazil and Chile specifically. We have also seen a dip in submissions from India in April, a month during which the cases of reported cases of the Coronavirus has increased in that region.

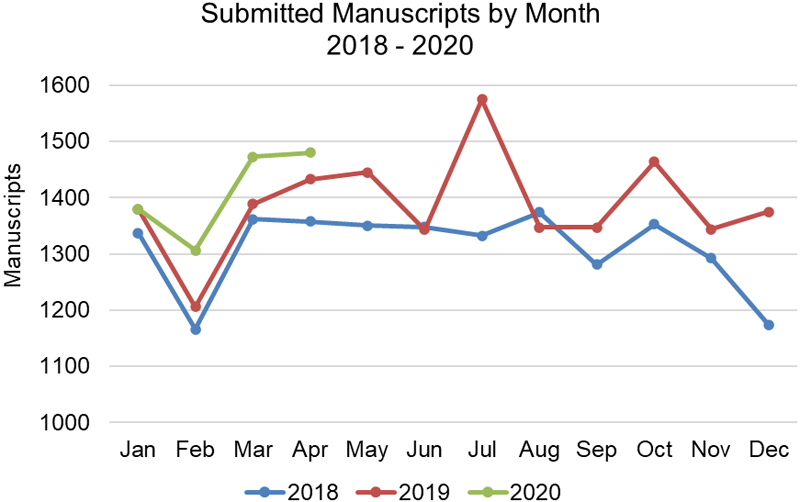
Not too much should be read into slight dips in February because the general trend across all submissions, as shown in the figure below, is a noticeable drop in February each year followed by a recovery in March. There are likely several reasons. For example, January is usually busy for submissions because people have time during the holidays to work on research papers before the university terms start. Late January and early February see the annual Chinese New Year celebrations with a long holiday taken in that region. And, of course, February has fewer days than January and March.
With data for only the first four months of the year, it’s difficult to tell whether the impacts of the virus and lockdown in different regions has had an effect on our submissions.

AGU is committed to monitoring the data as different countries ease restrictions on movement and we are in a place to look back at the whole of 2020.
By looking at these data on journal article submissions, can you tell we are in the midst of a pandemic? Not really. AGU is committed to monitoring the data as different countries ease restrictions on movement and we are in a place to look back at the whole of 2020. We will also examine how the crisis might have affected others involved in our publishing operations, such as reviewers and editors, for example changes in volume or rate of reviewing papers and making decisions on manuscripts.
For now, AGU is continuing to support our community by providing pandemic-related resources, including granting deadline extensions for journal authors and reviewers. How has COVID-19 impacted your work and life, and how can AGU help? Share your story with us.
—Paige Wooden ([email protected]; ![]() 0000-0001-5104-8440), Senior Program Manager, Publications Statistics, American Geophysical Union
0000-0001-5104-8440), Senior Program Manager, Publications Statistics, American Geophysical Union
Citation:
Wooden, P. (2020), How is the pandemic affecting AGU journal article submissions?, Eos, 101, https://doi.org/10.1029/2020EO144630. Published on 27 May 2020.
Text © 2020. The authors. CC BY-NC-ND 3.0
Except where otherwise noted, images are subject to copyright. Any reuse without express permission from the copyright owner is prohibited.

