By the end of the decade, we are likely to see a severe shortage of geoscientists because 48% of the current workforce will be at or near retirement age, predicts a 2016 geosciences workforce report from the American Geosciences Institute [2016]. Addressing this shortage will require our best efforts to attract students to geosciences and to help them succeed and retain their interest once they enter the field.
One barrier to initial student success in the geosciences (and in scientific fields in general) is weak spatial skills [Uttal and Cohen, 2012]. Spatial thinking skills help students and experts understand concepts in terms of the shapes, sizes, orientations, locations, directions, or trajectories of objects, processes, events, or phenomena. Spatial thinking is used to structure problems, find answers, and express these solutions to others. Therefore, providing training that supports spatial reasoning throughout students’ careers could encourage students to pursue geosciences as a career and increase the number of potential geoscientists.
Cognitive scientists specializing in spatial reasoning have been collaborating with geoscientists for about a decade as part of a National Science Foundation Science of Learning initiative that includes the Spatial Intelligence and Learning Center and the Geoscience Education Transdisciplinary Spatial Learning Network. Here we describe two studies from this initiative that address two areas in which students commonly encounter difficulties: understanding block diagrams and geologic time.
Two Problems Share a Common Solution
Repeated opportunities to predict and then compare create a cycle of learning where a student’s model improves and approximates the expert’s model.
Each study aimed to facilitate students’ comprehension of two different fundamental geoscience problems, and a common pattern emerged. In both cases, we found that students revised their misconceptions and developed a deeper understanding of the world when they made predictions using their current mental model, which is the thought processes about how something works in the real world, and then compared their prediction immediately to a correct solution.
Repeated opportunities to predict and then compare create a cycle of learning where a student’s model improves and approximates the expert’s model. With this new approach, we can improve understanding of challenging spatial reasoning problems. The prediction-comparison-feedback learning cycle has a formal similarity to scientific research methodology and human perceptual processing (a mental process that a person uses to organize and interpret information from the outside world). Cycle-based learning can act as an efficient scaffold for spatial learning in the geosciences, even among students working independently with no instructor support.
From Cross Sections to 3-D Structures

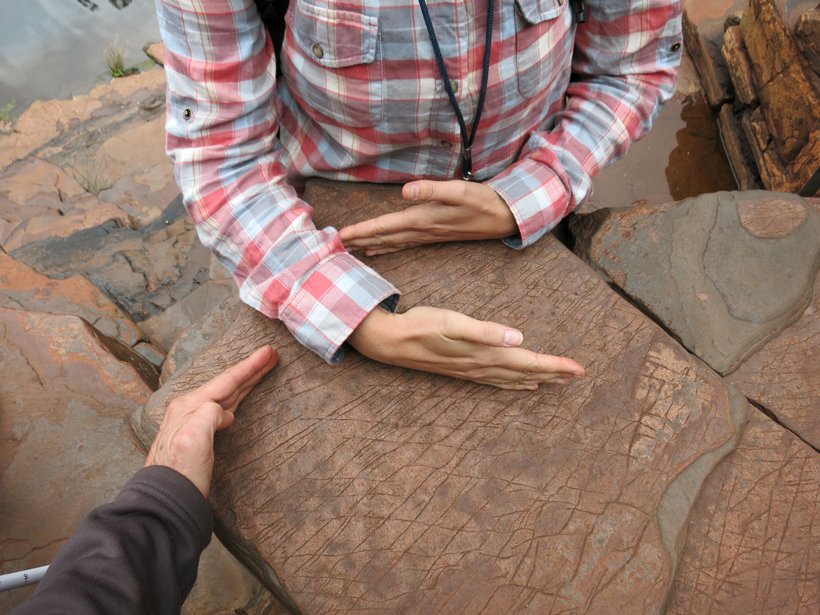
Students have great difficulty reasoning about diagrams [Hegarty, 2014], particularly diagrams that convey three-dimensional spatial information, such as geological block diagrams (Figure 1), which make up approximately 17% of all visualizations in introductory textbooks [Atit et al., 2015]. Students often have trouble coordinating information on the orthogonal faces of a block model to accurately estimate 3-D internal structures; many students simply assume that what is seen on one face is what would be seen inside the volume [Alles and Riggs, 2011]. This difficulty in visualizing 3-D structures extends beyond the classroom. For example, on a field trip, a student might generate erroneous predictions about how outcrops connect below the surface.
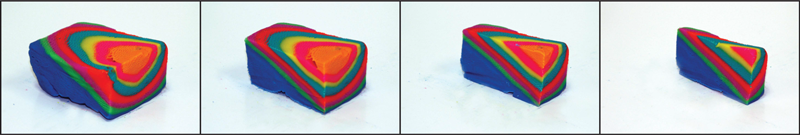
To examine whether generating a prediction and immediately comparing the prediction to the correct solution could facilitate diagram understanding, Gagnier et al. [2017] asked non–geology major students in a one-on-one experimental psychology laboratory setting to view a series of images of block models, each with an indicated cut through the interior (Figure 2). The students were then asked to sketch their prediction for the resulting cross section. Immediately afterward, students were shown the correct answer (the block model after the cut) and asked to compare their prediction to the correct answer.
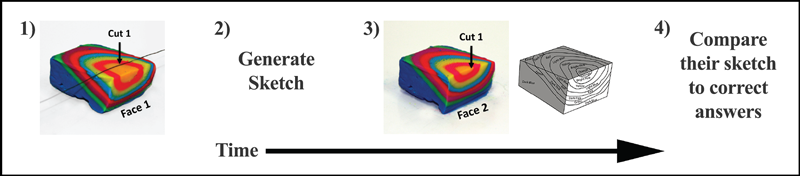
In this way, students received information that either confirmed their prediction or provided spatial information about the nature of the error that could be used to improve the next prediction. The results indicated that after 45 minutes and after as many as 12 tries at generating a spatial prediction diagram and comparing it to the correct answer, students improved by a half of a standard deviation on a measure of geologic block diagram understanding compared to students who viewed the correct answer but did not generate a predictive diagram.
Reasoning About Deep Time
Another area where students struggle is in understanding the magnitude of deep time, which leads to incorrect estimates of the rates of geologic events. Students’ estimates of events that occurred in Earth’s history can be off by as much as five orders of magnitude [Catley and Novick, 2008].
To examine whether making a prediction with spatial feedback could facilitate understanding geologic time, Resnick et al. [2017] conducted an experiment in six large general education classes over three semesters. During class lectures, students were presented with their textbook’s geologic timescale, which compresses the space representing the Precambrian and expands the space representing the time since the Precambrian when fossilized life is preserved and abundant (Figure 3).
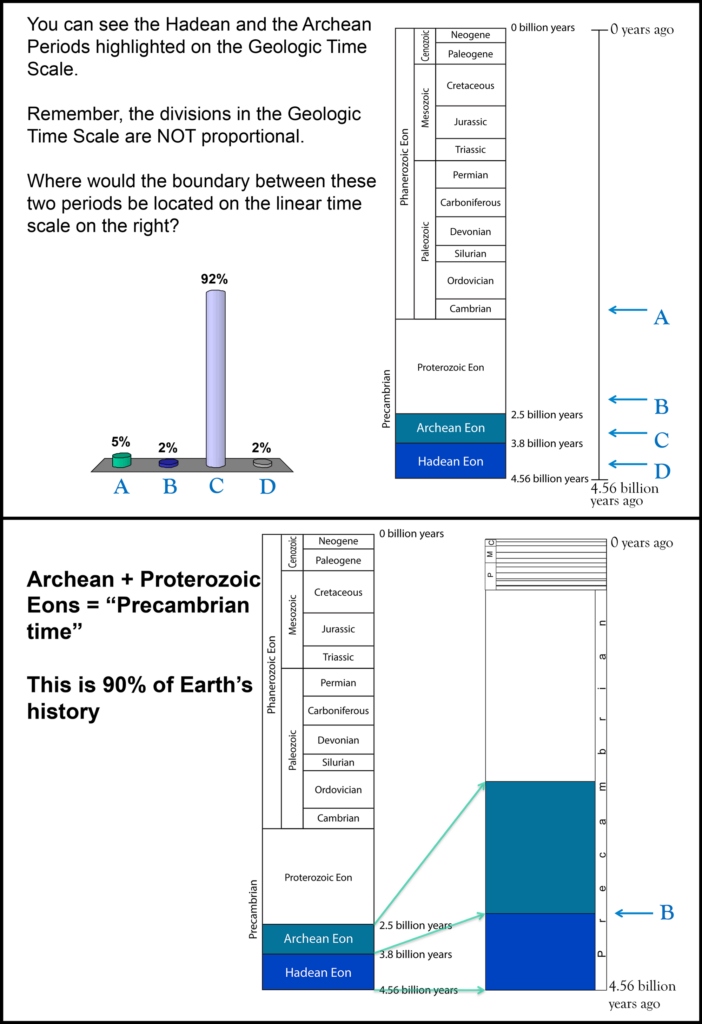
Each student used a handheld individual response device (a clicker) to choose from five options for marking the location of an eon, era, or period boundary on a linear scale. The class was immediately shown the distribution of student responses, followed by a slide with the correct answer, so that they could compare their responses.
Students improved their performance on exams after they had engaged in a prediction-feedback cycle during class. We observed an increase of more than 5 percentage points in exam scores compared to a class that saw only the standard image of the geologic timescale. An increase of more than 10 percentage points was observed compared to a class that saw the same slides (i.e., the standard geologic timescale and then the linear timescale) but did not actively engage in making a prediction.
This finding suggests that actively committing to a prediction is critical to the learning process. Students who are passively presented with questions and answers never have a chance to check and then change their mental models in response to new information.
Students who made timescale predictions also performed better (50% reduction in error) on number line estimations on the billion scale (e.g., locating 150 million on a 0–4.6 billion number line) compared to the no-experience control. Students who passively viewed the correct answer did not differ from the control group that saw only the standard textbook diagram. This outcome suggests that students are able to transfer their learning to reasoning about other scales more broadly [Resnick et al., 2017].
A Versatile Approach
Despite different content, the interventions share a design that led to improved learning. First, students in both studies were asked to generate an external representation of a prediction (in the form of a sketch or answer choice) that could be compared against the correct answer. Second, students were immediately shown the correct answer and asked to spatially compare their prediction to the correct answer. We argue that these factors are critical in facilitating spatial learning, which, in turn, leads to the development of more accurate mental models.
The prediction-comparison-feedback cycle was successful in both studies despite their structural differences, suggesting that this cycle could be adapted to a range of pedagogical settings. For example, the block diagram intervention requires a full class period to complete, whereas the deep time intervention required only about 3 minutes of lecture time.
Sketching block diagrams presents students with unconstrained options for what they can include in their external representation of their prediction and thus requires more time. In contrast, options presented as multiple-choice selections limit the number of possible external responses, and the exercise can be completed quickly. Constructing the problems and correct answers ahead of time enables this approach to be used with or without an instructor present, in small to large classrooms, or as a homework assignment.
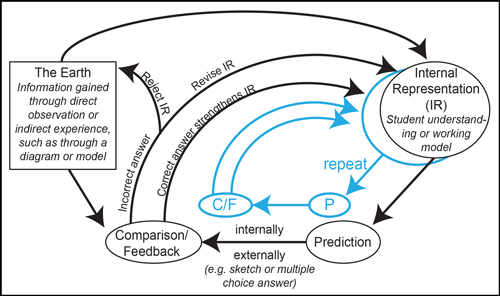
Prediction can be manifested in two ways (Figure 4): internally, where the prediction is expressed mentally, and externally, where students select a multiple-choice answer or draw, voice, or gesture their predictions. We suggest four ways in which students gain by externalizing their predictions:
- Students must commit to their prediction.
- Externalizing provides a lasting record of their thinking.
- Students can make a deliberate comparison between the prediction and the correct answer, which provides a spatial error signal.
- Faculty can use this external representation for formative assessment.
Applying This Method to Course Work
In a typical lecture class, students view slides and take notes. Although the note-taking may seem active, it is mentally passive, as it involves no active prediction or inferences on the part of the student and provides no way to check if the students’ and instructor’s understandings match.
Several lessons from cognitive science research help us understand why the prediction-comparison-feedback cycle improves student learning (for a review, see Resnick et al. [2017]):
- Viewing the prediction and correct answer at the same time helps the student detect differences.
- Students get immediate self-generated feedback to compare with their active mental representation; this is superior to delayed-feedback methods like graded exams and homework.
- When students can repeat the process, through multiple opportunities to make relevant comparisons, this repetition reinforces the correct representation and corrects incorrect representations.
When faculty ask students to engage in this prediction-comparison-feedback cycle, they must choose the type of external representation students make (e.g., a sketch or a multiple choice answer). The optimal choice will likely depend on whether common types of errors on the task can be anticipated. If the errors are well known, then a multiple-choice test (with likely errors used as foils) is likely to facilitate efficient learning. If the foils represent common misconceptions, then students will be forced to engage in a deeper comparison to make their selection, which should promote learning. However, in cases where the errors are unknown, it may be best to ask students to generate their own representations.
Our research suggests an effective method for incorporating sketching into the classroom in a way that requires minimal investment from the instructor. Sketches may be time-consuming for an instructor or teaching assistant to correct, but the instructor only needs to prepare the solution sketch. Individual students can evaluate their own sketches in only a few minutes. The student’s prediction and subsequent comparison can facilitate learning and help guide the student’s internal representation even in the absence of one-on-one teacher interaction.
This concept may be broadly applied to a diverse array of topics and content areas but is particularly useful for complex spatial concepts for which the misconceptions in the students’ internal models may be varied or unknown. Faculty designing activities should have students independently make a sketch, receive a correct sketch from the instructor, and then follow up with a reflection on how their sketch differed from the “correct” sketch, with multiple opportunities to generate predictions for similar problems.
Building a Learning Framework
This cycle can scaffold geoscience learning and ultimately set students on a course toward the type of hypothesis testing required in scientific inquiry.
Generating a prediction and then comparing the prediction to the correct answer provides a scaffold for spatial learning with minimal time requirement. Students develop understanding of spatial problems by engaging in a cycle of learning in which they form a prediction, express it outwardly, and then compare their prediction to the correct answer. This process lets them receive immediate feedback on their prediction. This cycle can scaffold geoscience learning and ultimately set students on a course toward the type of hypothesis testing required in scientific inquiry.
Acknowledgments
Preparation of this article was supported in part by National Science Foundation grants SBE-0541957 and SBE-1041707 to support the Spatial Intelligence and Learning Center and grant SBE-1640800 to T.F.S. and A.D.
References
Alles, M., and E. M. Riggs (2011), Developing a process model for visual penetrative ability, in Qualitative Inquiry in Geoscience Education Research, edited by A. D. Feig and A. Stokes, Spec. Pap. Geol. Soc. Am., 474, 63–80, https://doi.org/10.1130/2011.2474(06).
American Geosciences Institute (2016), The Status of the Geoscience Workforce 2016, Alexandria, Va.
Atit, K., K. Gagnier, and T. F. Shipley (2015), Student gestures aid penetrative thinking, J. Geosci. Educ., 63(1), 66–72, https://doi.org/10.5408/14-008.1.
Catley, K. M., and L. R. Novick, (2008), Seeing the wood for the trees: An analysis of evolutionary diagrams in biology textbooks, BioScience, 58, 976–987, https://doi.org/10.1641/B581011.
Gagnier, K. M., et al. (2017), Comprehending 3D diagrams: Sketching to support spatial reasoning, Top. Cognit. Sci., 9(4), 883–901, https://doi.org/10.1111/tops.12233.
Hegarty, M. (2014), Spatial thinking in undergraduate science education, Spat. Cognit. Comput., 14, 142–167, https://doi.org/10.1080/13875868.2014.889696.
Resnick, I., et al. (2017), Using analogy to learn about phenomena at scales outside human perception, Cognit. Res. Princ. Implic., 2(1), 21, https://doi.org/10.1186/s41235-017-0054-7.
Uttal, D. H., and C. A. Cohen (2012), Spatial thinking and STEM education: When, why, and how?, Psychol. Learn. Motiv., 57, 147, https://doi.org/10.1016/B978-0-12-394293-7.00004-2.
Author Information
Alexandra Davatzes (email: [email protected]), Department of Earth and Environmental Science, Temple University, Philadelphia, Pa.; Kristin Gagnier, Science of Learning Institute, Johns Hopkins University, Baltimore, Md.; Ilyse Resnick, Department of Psychology, Pennsylvania State University Lehigh Valley, Center Valley; and Thomas F. Shipley, Department of Psychology, Temple University, Philadelphia, Pa.
Citation:
Davatzes, A.,Gagnier, K.,Resnick, I., and Shipley, T. F. (2018), Learning to form accurate mental models, Eos, 99, https://doi.org/10.1029/2018EO091643. Published on 07 February 2018.
Text © 2018. The authors. CC BY 3.0
Except where otherwise noted, images are subject to copyright. Any reuse without express permission from the copyright owner is prohibited.