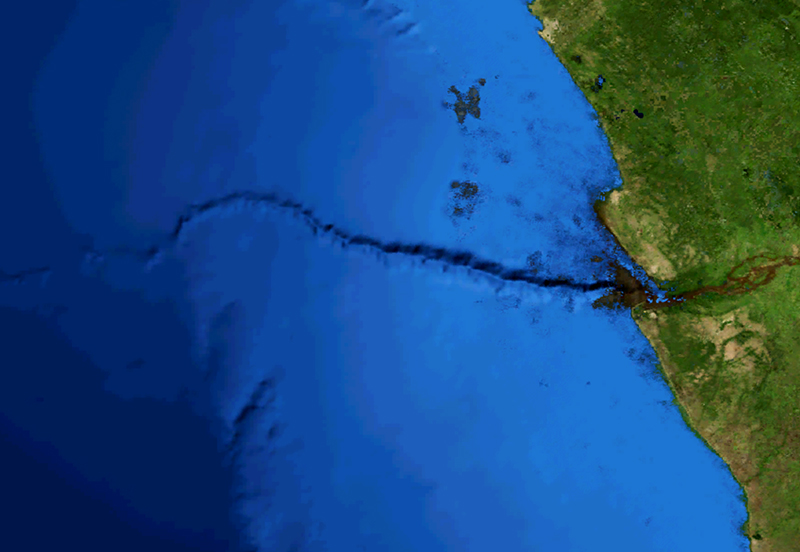
The Congo River doesn’t end where it meets the Atlantic Ocean—not by a long shot. You can follow pulses of its sediment-laden water for hundreds of kilometers as they shoot away from the coast of Africa, down the continental slope, through a canyon that in places cuts a kilometer deep, and eventually deposit their load in a fan-shaped formation the size of Arizona.
These pulses are called turbidity currents. They form when water becomes so heavy with sediment (hence turbid, or muddy) that the weight of the particles drives the mixture down a slope. The currents are often released from rivers but also can originate at sea, caused by earthquakes, landslides, tides, and even activity from fishing trawlers.
Turbidity currents occupy the minds of scientists of all stripes: Engineers worry about the damage they can do to submarine infrastructure; oceanographers want to understand how they sculpt the areas they traverse; geologists study the formations (turbidites) they leave behind. And climatologists are starting to reckon with the capacity of the largest turbidity flows to help regulate climate.
“The flows in the Congo Canyon seem to carry about 2% of the organic carbon that is transported into the deep ocean over the whole world every year. Just this one canyon.”
Every year, for instance, the Congo Canyon serves as a conduit to the ocean floor for tens of millions of tons of organic matter culled from the river’s watershed on the African continent. The submarine canyon keeps the carbon-rich sediment removed from the atmosphere for millions of years, in which time it may give rise to oil and gas fields.
“The flows in the Congo Canyon seem to carry about 2% of the organic carbon that is transported into the deep ocean over the whole world every year. Just this one canyon,” said Matthieu Cartigny, an Earth scientist from Durham University in the United Kingdom. “There are many, many submarine canyons in the world. So these processes must play a dominant role, impacting the carbon cycle and thereby the climate.”
Elucidating the role of these flows in the world’s climate is an important reason to study turbidity flows. Another is to prevent these forces of nature from colliding with human infrastructure under the waves.
A classic example of this interference happened in 1929, when 12 transatlantic cables snapped after the magnitude 7.2 Grand Banks earthquake off the eastern coast of Canada. Five of these cables broke 13 hours after the quake, one after the other, from north to south. Not until more than 2 decades later did Bruce Heezen and Maurice Ewing of Columbia University put forward a solution to the mystery: The earthquake had caused an undersea landslide, and a turbidity current had propagated toward the cables and taken them out.
While communications technology progressed, data collection on the phenomenon hardly did. In 2006 and 2009, turbidity flows in the Gaoping Submarine Canyon off Taiwan caused fiber-optic cables between North America and Asia to break. From the distances between the cables and the times of failures, the currents’ velocities were estimated to lie between 5.6 and 12.6 meters per second (20–45 kilometers per hour). But that was about all that could be said.
From “Nigh unto Impossible” to “Doable”
A picture has emerged of turbidity currents as an intricate dance of fluid and solids—not just a muddy submarine river that stops and starts, but also a flow in a class of its own.
“The general feeling was, it’s nigh unto impossible to actually study flows in the field in real time,” recalled Charlie Paull of the Monterey Bay Aquarium Research Institute (MBARI) in California. “For one, you need to go to a place where you’re likely to have something happen during the experiment, and there are precious few places on the Earth where we historically know that this will be possible. The flip side is, if you’ve found a place, you would have the nightmarish problem of putting expensive gear down and standing a high chance of losing it” to the onrushing cascade.
For that reason, researchers were forced to rely mostly on laboratory experiments, computer models, and analysis of geological features.
But in the past few years, “nigh unto impossible” has turned into “doable,” partly thanks to equipment that can study current velocities at a safe distance.
There are now a number of locations where turbidity currents have been studied in detail. One of them is the Monterey Canyon, at the head of which, conveniently, Paull’s MBARI is located. Another is the delta of the Squamish River in British Columbia in Canada. And a third is a stretch of the Congo Canyon.
From those places, each of which was studied using different instruments and focusing on different aspects of the currents, a picture has emerged of turbidity currents as an intricate dance of fluid and solids—not just a muddy submarine river that stops and starts, but also a flow in a class of its own.
Tumbling, Racing Sediments
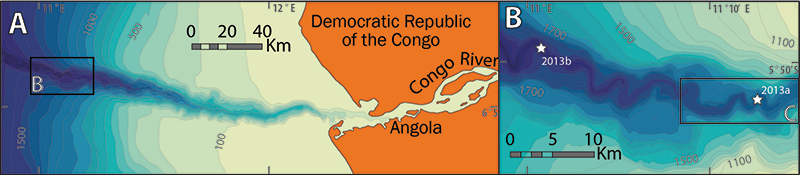
For getting a handle on what occurs in the Congo Canyon, scientists can thank the caution shown by the Chevron oil company in 2009 and 2010, said Cartigny.
“Chevron wanted to cross the canyon with a gas pipeline. Then somebody said, ‘That’s a big canyon; you might want to check before you put that expensive pipeline there.’ They put some instruments in, and they found there’s lots of flows, and then they decided they had better directionally drill under the canyon, at 2 kilometers of water depth, at great cost. There was far too much activity. They published this in a very small conference abstract, saying it might be of interest to other people. My colleague Peter Talling [also at the University of Durham] contacted them and said, ‘Th[ese are] amazing data; could we have [them]?’”
For the past 6 years, Cartigny and his colleagues have been working with the data that Chevron had gathered from the deep, using downward looking acoustic Doppler current profilers, instruments that bounce sound off particles suspended in water to measure flow velocity.
The scientists were immediately surprised.
“We always thought such flows would last minutes, or hours, maybe a couple of days if the river is in a flood and carries a lot of sediment,” Cartigny said. “But they lasted for a week to 10 days, longer than we’ve ever seen before with such currents. Also, we now know that the front of the flow moves at 1.4 meters per second, and the tail only 20 centimeters per second. We had so many questions.”
Laboratory experiments had suggested that the dense front part, the “head” of the turbidity current, would be the slowest, as it has to push aside the surrounding nonturbid, nonflowing water. Sediment from behind, unhindered in that way, would come in faster and pile up against the head.
“There doesn’t seem to be a relation to any floods, earthquakes, undersea landslides, or storms. Something else is happening.”
Instead, a turbidity current—at least when it is transporting very fine, muddy sediment, as in the Congo Canyon—is actually more like a powerful locomotive. This follows from an analysis of the measurements, published in the journal Science Advances by Cartigny’s Ph.D. student Maria Azpiroz-Zabala, now at Delft University of Technology in the Netherlands. The turbidity current’s head, heavy with suspended sediment, races downhill and scours the canyon. As long as the seafloor provides both grade and grime, this process can continue and, as the “body” of the sediment burst keeps lengthening, gives rise to the prolonged turbidity currents witnessed by the Chevron engineers.
Whether long or short, a turbidity current has to start somehow, somewhere. For the Congo Canyon, this is still a mystery, Cartigny said.
“There doesn’t seem to be a relation to any floods, earthquakes, undersea landslides, or storms. Something else is happening.”
Origins Predicted by Modeling
The origin of turbidity currents is easier to study with a smaller river and closer to shore.
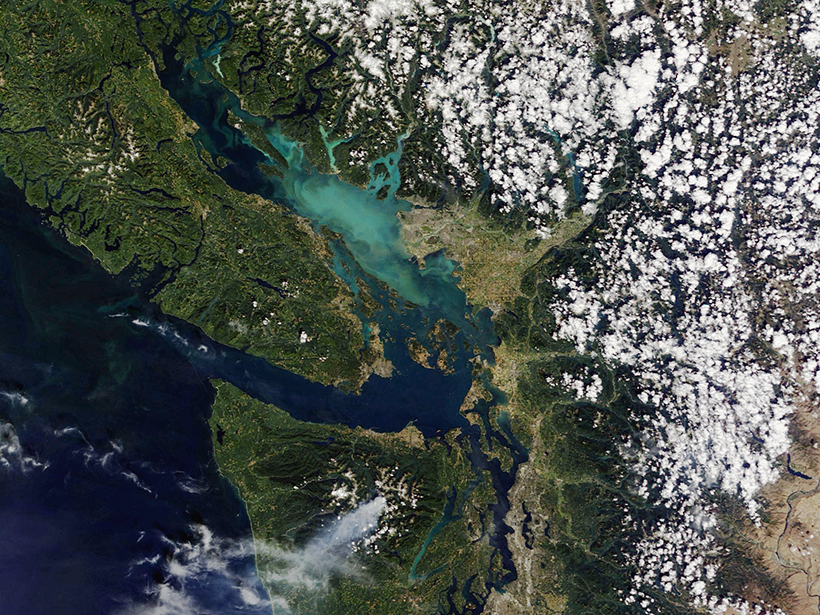
Talling and Cartigny’s team has been observing just such a location, the delta of the Squamish River in British Columbia, which regularly launches turbidity flows. The flows were not seen directly, but their occurrence was deduced by measuring sudden changes in the submarine topography of the delta.
Jamie Hizzett of the University of Southampton in the United Kingdom, a Ph.D. student of Cartigny’s, published an analysis of conditions associated with Squamish turbidity currents in Geophysical Research Letters.
Concrete events triggered about a quarter of the 95 currents Hizzett studied. Chief among these were undersea landslides, caused by sediment accumulating along a steep gradient until it became unstable.
But the vast majority of the turbidity currents, 73%, arose much more peacefully, with the river bringing in sediment gradually but turbidity currents taking off intermittently.
Cartigny is excited by this result, as it meshes with mathematical analysis and computer modeling of the start of turbidity currents done by Ricardo Silva Jacinto of the French marine research organization Institut Français de Recherche pour l’Exploitation de la Mer (Ifremer).
Jacinto concurs.
“What we are observing around the world is that we may have [many] more turbidite currents than we thought, and they may already happen with fairly dilute suspensions,” he told Eos.
Such a suspension can become supercritical: Any perturbations in the flow will travel more slowly than the flow itself. That includes any compression of the front part of the sediment flow, which will then be overtaken by more sediment and become even more dense.
“And so everything is ignited,” Jacinto said.
Helical Flows
Once launched, turbidity currents turn out to behave in ways not seen in any other flows.
In another paper published in Geophysical Research Letters, Azpiroz-Zabala showed that as sediment shoots through the Congo Canyon, it doesn’t just veer left and right as its channel meanders but follows a helical path. Such secondary circulation occurs in rivers as well, but as Azpiroz-Zabala discovered using the Chevron data, turbidity currents give this phenomenon their own unique twist.
In a river, the circulation is set up when the current is forced around a bend and the centrifugal force pushes the water up against the outer bank. Along the bottom, the difference in the water level results in higher pressure near that bank, causing water to flow inward, with a compensating flow outward nearer to the surface. Thus, a cell of circulating water is set up. Added to the downstream water movement, this results in a helical flow.
Researchers saw two helical flows on top of one another: the upper one riverlike, the bottom one river reverse.
Important for understanding the idiosyncrasies of turbidity currents, the water moving along the bottom from the outer toward the inner bank often will pick up sediment and thus become relatively heavy. As the river comes out of the meander and straightens, the higher pressure at the outer bank due to the centrifugal force weakens and is overpowered by the higher pressure at the inner bank due to the higher density of the water there. The resulting opposite circulation, more commonly seen in estuaries than in rivers, is called river reverse.
What pattern would dominate in turbidity currents? The observations of the Congo Canyon gave an answer no one expected: It’s both. As the flow started to leave the meander where the Chevron instruments were located, the researchers saw two helical flows on top of one another: the upper one riverlike, the bottom one river reverse.
In hindsight, having two patterns at once makes sense, as a turbidity current can be seen as two stacked rivers, with the top one upside down, Azpiroz-Zabala explained. “The fastest flow in a river is at the surface, but a turbidity current experiences friction both at the top, with the ambient water, and at the bottom. So the middle of the flow is going at the fastest speed.”
Breaking Ground Beneath the Currents
Whether the flows in the Monterey Canyon also display helical secondary circulation is not yet known, said Paull of MBARI. “I don’t think we’ve digested the data enough to make a serious comment about that. We’re still trying to understand the primary data set.”
For their recent study, Paull and his team made observations for 18 months, using not just acoustic Doppler current profilers but also dozens of other types of instruments. Their first result turned out to be literally groundbreaking.
Among the instruments researchers deployed were motion sensors, buried in the bottom sand like boulders. The sensors were expected to record how sand was moved by a turbidity current swooshing by. But what these “benthic event detectors” recorded instead was the canyon bottom itself moving downslope at speeds even greater than the water flowing over it.
“To what extent that was the preexisting bottom that is moving, and exactly how it’s moving, that’s still slightly murky,” said Paull. “But it is clear that a very dense layer down at the bottom is moving very quickly. And the turbulent cloud above, which is what many experiments have been measuring, is, at least in the Monterey Canyon, a by-product.”
That means that experimenters and computer modelers have some catching up to do, Paull said. “Models that don’t deal with a movable substrate but are done over a stainless steel surface at the bottom of a test tank are less valuable.”
Whether the bottom of the Congo Canyon also is an integral part of the turbidity currents there is something upcoming observations may establish. A cruise to place instruments at the canyon will take place in September 2019, and two more are planned for 2020 and 2021 for what is billed as “the first detailed measurements of turbidity currents in the deep-ocean.”
It won’t be easy, Paull predicts.
“The Monterey experiment took between 120 and 140 ship days. We could schedule things because it is right out our back door. We could launch multiple short day trips to talk to equipment on the seafloor, to see what its status was. We had instruments that would tell us if something happened, so we could launch event response cruises. It’s going to be hard in the Congo Canyon, going by for just a few times on a ship, in a very set time window. And it’s much deeper water. But [it’s] well worth trying!”
—Bas den Hond ([email protected]), Freelance Journalist
Citation:
den Hond, B. (2019), Mud on the move, Eos, 100, https://doi.org/10.1029/2019EO122329. Published on 21 May 2019.
Text © 2019. The authors. CC BY-NC-ND 3.0
Except where otherwise noted, images are subject to copyright. Any reuse without express permission from the copyright owner is prohibited.