
As most people know, Phoenix is hot in summer. In fact, there are about 100 days per year where the temperature in Arizona’s capital city is 100°F or hotter.
This curious observation is reminiscent of the way scientists measure the impact of their publications, the so-called h-index. A scientist has an h-index of h if he or she has h publications that have been cited h or more times, for example, Michael O’Keeffe has h = 109.
This analogy suggests that cities could be assigned a hotness index, or H-index, defined as the number of days H that the daily maximum Fahrenheit temperature is H or above.
Undergraduate Student Project
Although we are not weather scientists, finding the H-indexes of cities made an interesting undergraduate student project for Christopher Ramirez, a biophysics major.
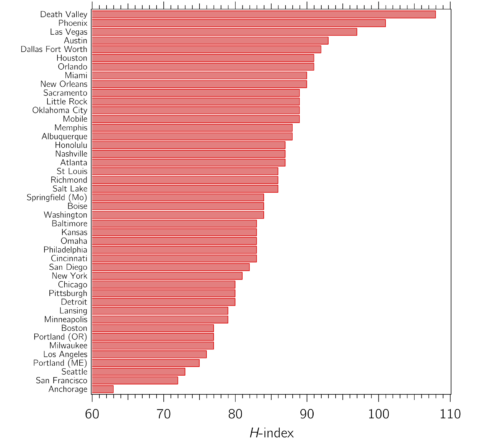
Phoenix had an H-index of 102 in 2018: There were 102 days for which the maximum daily temperature was at least 102°F.
The project required learning some Python programming, locating a suitable database of daily maximum temperatures (the National Oceanic and Atmospheric Administration (NOAA) database was appropriate for U.S. cities and for participating locations around the world), deciphering the database structure, and then patiently sifting through the data.
By the end of the semester, with all of the debugging headaches behind us, we learned that in 2018, Phoenix had 102 days for which the maximum daily temperature was at least 102°F—an H-index of 102.
Of course, we had to compare Phoenix with other cities in Arizona: Tucson was 97, Flagstaff was 79, and Yuma was 103. Death Valley, Calif., was an impressive 109, although, mercifully, there is not a city of 4.5 million people trying to live there. When one lives in Phoenix, it is hard not to feel a little bit competitive about H-indexes, and there is an urge to make a comparison with other cities in the United States and around the world.
It is an interesting coincidence that the Fahrenheit scale is close to optimal for this kind of hotness measurement and is intuitively easy to understand. The Celsius scale and, certainly, the Kelvin scale do not lend themselves favorably to this kind of measure.
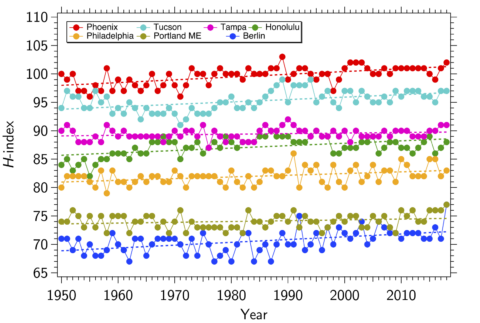
For a meaningful H-index to be measured, it is important that there be a continuous recording of maximum daily temperatures. In the NOAA database, airports tended to provide the most complete data. For example, at Sky Harbor International Airport in Phoenix, a clear trend shows that the H-index has been increasing by 1 about every 20 years since 1950.
Phoenix has grown significantly since then, and the replacement of farmland with concrete- and asphalt-paved structures may be a significant contributor in the rise of the H-index there: the so-called urban heat island effect. Most other locations show a similar rise.
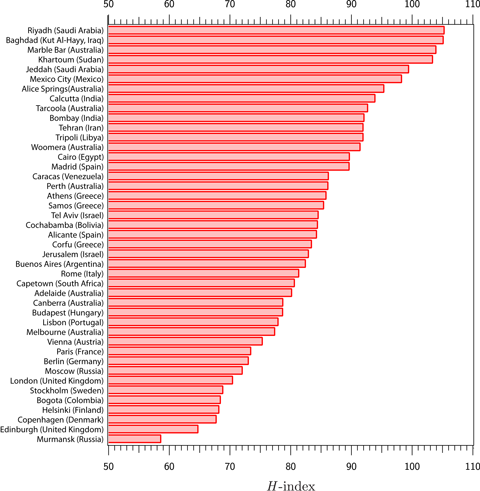
The ranked distribution of H-indexes of cities presents an S-shaped profile. The upper and lower bounds represent the limits that people are willing to endure. Riyadh, Saudi Arabia, has the highest H-index of the major cities we examined, with an average H-index of 105.
A similar coldness index, a C-index, can be constructed by referencing the number of days below the freezing point of water. The Celsius scale may be more intuitive for this measure, but the smaller degree step size of the Fahrenheit scale provides more sensitivity. Thus, the C-index is the number of days C at which the Fahrenheit temperature relative to the freezing point of water, Tmin − 32°F, is −C or less.
Sheremetyevo Alexander S. Pushkin International Airport, which serves Moscow, Russia, has a typical C-index of 28, meaning that there are typically 28 days in the year at which Tmin is 4°F or lower, that is, 28 days where the daily lowest Fahrenheit temperature is 28°F or more below the freezing point of water. Phoenix Sky Harbor Airport has a typical C-index of zero, meaning that it rarely freezes there. The suburbs of Phoenix can have a C-index of about 2 (i.e., 2 days where the lowest temperature was 30°F or below), providing more evidence of the urban heat island effect.
Examining the H– and C-indexes can quickly reveal interesting details about locations around the world. For example, Edinburgh, Scotland, has a lower H-index than Moscow (65 versus 72), and Moscow also has a significantly higher average C-index, 28 versus Edinburgh’s 5. We can see quickly that Edinburgh experiences a smaller temperature range than Moscow.
Instead of asking how hot or cold, these indexes ask “How consistent?”
Ramirez states that both the H-index and C-index are an interesting, and possibly more relevant, method of representing the temperature component of a location’s climate compared with more traditional techniques. Instead of asking how hot or cold, these indexes ask “How consistent?” When paired with the average temperature, these indexes can provide a more complete picture of the temperature of a location over time.
—Michael M. J. Treacy ([email protected]) and Christopher N. Ramirez, Department of Physics, Arizona State University, Tempe; and Michael O’Keeffe, School of Molecular Sciences, Arizona State University, Tempe
5 July 2019: This article has been updated to insert the correct graph showing the H-indexes of select world airports.
Citation:
Treacy, M. M. J.,Ramirez, C. N., and O’Keeffe, M. (2019), Hotness and coldness indexes based on the Fahrenheit scale, Eos, 100, https://doi.org/10.1029/2019EO127323. Published on 05 July 2019.
Text © 2019. The authors. CC BY-NC-ND 3.0
Except where otherwise noted, images are subject to copyright. Any reuse without express permission from the copyright owner is prohibited.