

Long-term planning and decision-making for fundamental societal infrastructure must take a changing climate into account. This infrastructure includes elements such as transportation, energy supply, and water and drainage systems. Typically, the relevant climate projections include substantial inherent uncertainty, and appropriately accounting for this uncertainty is critical to good decision-making.
To this end, decision-makers, engineers, and scientists from all fields urgently need new generic eScience tools. These data-intensive, information technology–intensive, and collaborative capabilities enable users to apply the extensive existing repositories of observations and climate model data as well as recent methods for uncertainty quantification in climate science.
In the Nordic Council–funded project eScience: Statistical Analysis of Climate Projections (eSACP), climate scientists and mathematical scientists from seven partner organizations (including the national meteorological institutes) in Denmark, Finland, and Norway joined forces to develop a suite of open access tools for climate assessment. The tools provide the following:
- functionality to handle automatic downloads from the dynamically growing data repositories
- methodology to effectively quantify and visualize uncertainty in climate projections
- a multiplatform approach to decision-making under uncertainty that can flexibly be tailored toward a variety of situations
Our focus has been on Nordic data and local or regional questions regarding temperature, precipitation, wind, and sea level. Here we describe several of the tools we developed under the eSACP project.
Making Data Manageable
One important objective of eSACP was to distill relevant information from large data volumes and from multiple sources. One prototype app developed by the Norwegian Meteorological Institute (NMI) presents empirical-statistical downscaling results for large multimodel ensembles of global climate models (Coupled Model Intercomparison Project 5 (CMIP5)) based on R Shiny, an interactive Web app builder for the R computer language [Benestad et al., 2017a]. The results presented in the app are based on a data compression technique called singular vector decomposition that reduces the data volume while retaining the most important information from climate model ensembles [Benestad et al., 2017b].
One analysis highlights the presence of nonstationarity in sea level, not just in terms of rising mean seas but also in the height of storm-driven surges.
The three meteorological institutes collaborated on a method to analyze extreme values of storm-driven sea level surges by analyzing Danish sea level tide gauge records (P. Thejll et al., Non-stationarity in Esbjerg sea-level return levels: Applications in climate change adaptation, submitted to Extremes, 2019). For this analysis, they used storm tracks found by analyzing reanalysis data over the north European area, derived by the Finnish Meteorological Institute and visualized by its Norwegian counterpart, NMI. The extreme surges display nonstationarity (a change in what is considered normal) and depend on mean sea level for their location and the North Atlantic Oscillation index for their scale parameter, with the latter being related to the spread of storm tracks near Denmark.
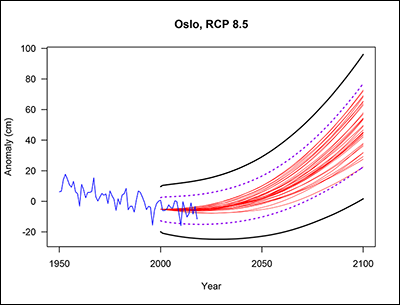
In another effort, we used a statistical downscaling approach for sea levels [Bolin et al., 2015] to produce sea level projections for all Permanent Service for Mean Sea Level stations with known glacial isostatic adjustment in Denmark (6 sites), Finland (12), Norway (8), and Sweden (5). Figure 1 shows the projections under the Representative Concentration Pathway (RCP) for Oslo, Norway, using RCP 8.5, a relatively high estimate of greenhouse gas emissions. (Norwegian authorities require communal planning to be based on the 95th percentile of RCP 8.5.)
Thorarinsdottir et al. [2017] and Guttorp and Thorarinsdottir [2018] describe how to combine sea level rise projections and decision-making into adaptation plans. This work is continued in a further collaboration between colleagues from the Norwegian Computing Center, Danish Meteorological Institute (DMI), and Technical University of Denmark (DTU). The new study assesses sea level in three Danish coastal cities. The analysis highlights the presence of nonstationarity in sea level, not just in terms of rising mean seas but also in the height of storm-driven surges. These results will be used in a future study of the costs to the communities of such changes, given projected future climate change.
Getting the Word Out and Moving Ahead
Our project also organized a workshop bringing together practitioners and researchers to discuss “practical and methodological challenges of climate change adaptation” [Thorarinsdottir and de Bruin, 2016]. Climate scientists, environmental economists, statisticians, climate service providers, and practitioners in various decision contexts, mainly at the city and state levels, attended the workshop, which was structured around three themes: adaptation, uncertainty, and visualization. Discussions during the workshop provided the project with valuable feedback from practitioners regarding both the content and the presentation of climate information needed in practice.
The amount of money in our project grant was quite modest, but the work has had substantial consequences.
The amount of money in our project grant was quite modest, but the work has had substantial consequences. Although R Shiny apps might not be the optimal design for eScience products with a large number of users, this approach is very efficient for the necessary experimentation and prototyping before a full-fledged product can be designed and built. For example, NMI is currently applying this same approach to develop prototypes of further applications for visualizing and exploring climate model data in the Copernicus Climate Change Service project Data Evaluation for Climate Models. This work directly builds upon work that started with eSACP.
Several of eSACP’s original aims are met by the forthcoming Danish Climate Atlas (DCA) to be hosted at DMI. The objective of DCA is to deliver a common Danish data set for use in, for example, climate adaptation based on national and international data repositories, including tools for decision support and for visualization and analysis of the expected impacts of climate change on society. The DCA will use several of the methodologies developed in eSACP, including the above-mentioned statistical downscaling approach for sea levels. Guttorp et al. [2014] further developed this approach, and it is currently used in a joint Ph.D. study between DMI and DTU that will feed into the DCA.
The atlas, which received funding in 2017, is scheduled to reach the first milestone in September 2019: delivery of an eScience information portal. This portal will allow citizens and end users in municipalities as well as from engineering consultancy businesses to evaluate the expected climate-driven impacts and to download quantitative data.
Acknowledgments
This research was partially funded by the Nordic Council. Data and code are available at the project website. The partners of eSACP are the Norwegian Computing Center (lead), Norwegian Meteorological Institute, Uni Research Norway, Finnish Meteorological Institute, University of Helsinki, Danish Meteorological Institute, and the Technical University of Denmark.
References
Benestad, R., et al. (2017a), A strategy to effectively make use of large volumes of climate data for climate change adaptation, Clim. Serv., 6, 48–54, https://doi.org/10.1016/j.cliser.2017.06.013.
Benestad, R., et al. (2017b), New vigour involving statisticians to overcome ensemble fatigue, Nat. Clim. Change, 7(10), 697–703, https://doi.org/10.1038/nclimate3393.
Bolin, D., et al. (2015), Statistical prediction of global sea level from global temperature, Stat. Sin., 25, 351–367, https://doi.org/10.5705/ss.2013.222w.
Guttorp, P., and T. L. Thorarinsdottir (2018), How to save Bergen from the sea? Decisions under uncertainty, Significance, 15(2), 14–18, https://doi.org/10.1111/j.1740-9713.2018.01125.x.
Guttorp, P., et al. (2014), Assessing the uncertainty in projecting local mean sea level from global temperature, J. Appl. Meteorol. Climatol., 53, 2,163–2,170, https://doi.org/10.1175/JAMC-D-13-0308.1.
Thorarinsdottir, T. L., and K. de Bruin (2016), Challenges of climate change adaptation, Eos, 97, https://doi.org/10.1029/2016EO062121.
Thorarinsdottir, T. L., et al. (2017), Sea level adaptation decisions under uncertainty, Water Resour. Res., 53(10), 8,147–8,163, https://doi.org/10.1002/2016WR020354.
Author Information
Peter Guttorp ([email protected]) and Thordis L. Thorarinsdottir, Norwegian Computing Center, Oslo
This story is part of Covering Climate Now, a global collaboration of more than 250 news outlets to strengthen coverage of the climate story.
Citation:
Guttorp, P.,Thorarinsdottir, T. L. (2019), Local climate projections: A little money goes a long way, Eos, 100, https://doi.org/10.1029/2019EO133113. Published on 17 September 2019.
Text © 2019. The authors. CC BY 3.0
Except where otherwise noted, images are subject to copyright. Any reuse without express permission from the copyright owner is prohibited.