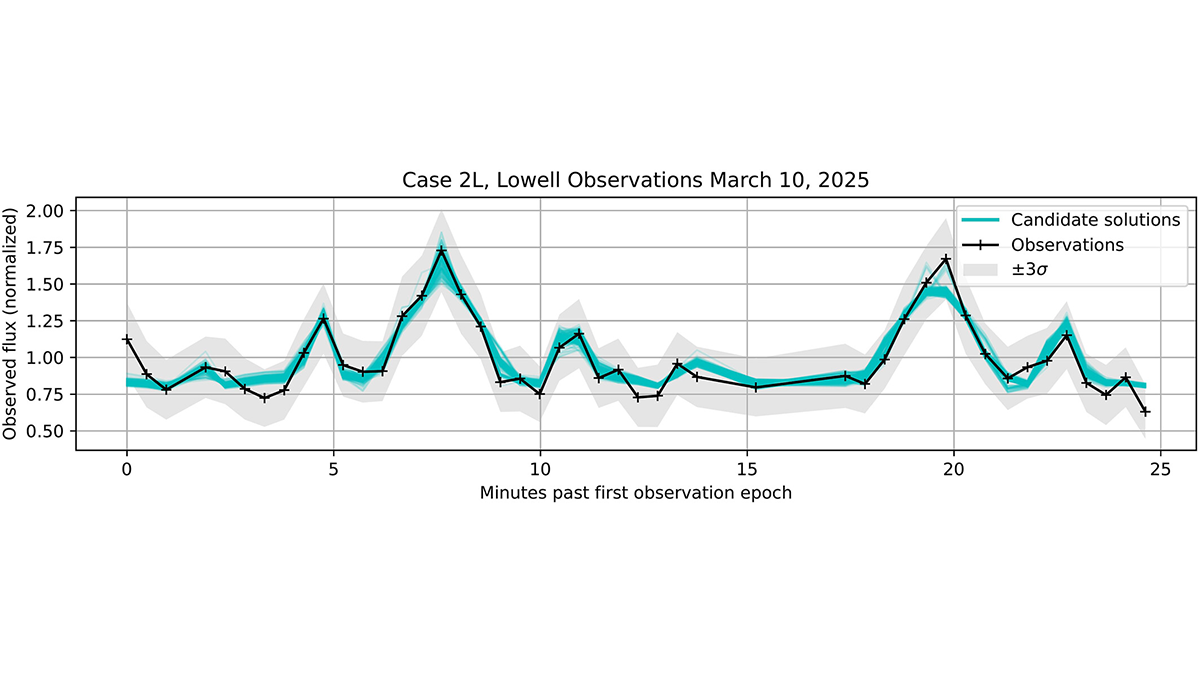
Learning from the attempted rescue of the Lunar Trailblazer: how ground-based optical observations and laboratory measurements can improve recovery of the attitude of a spacecraft lost in space.
Earth and Space Science
Posted inEditors' Highlights
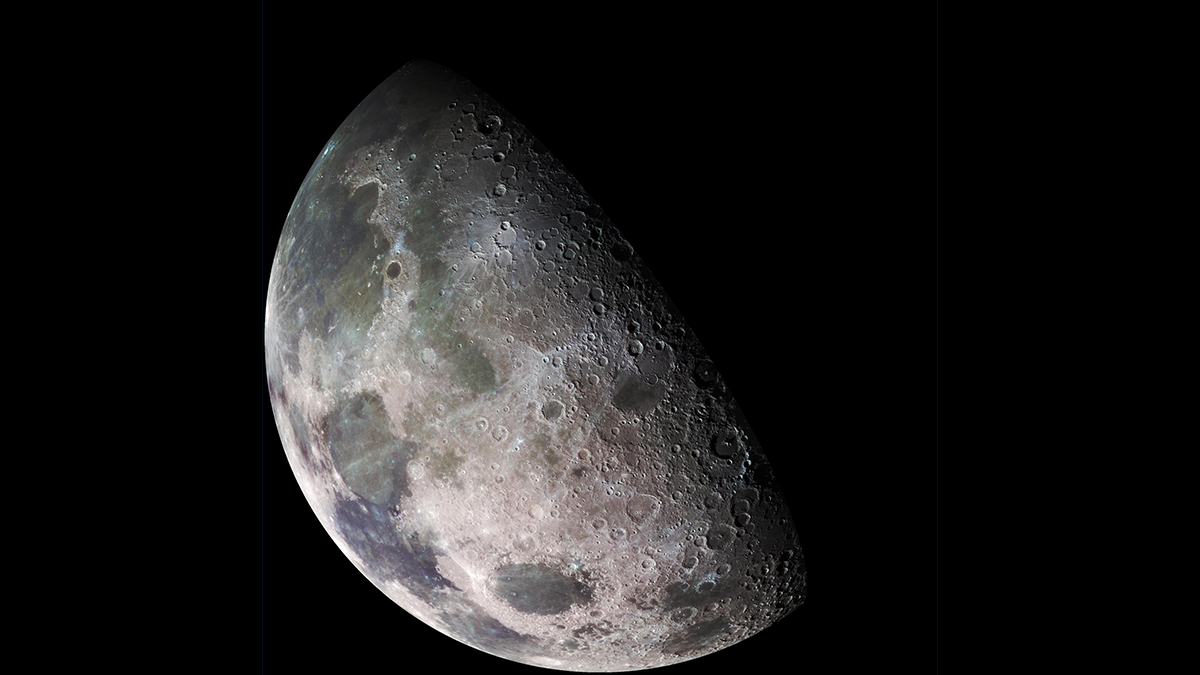
Using Distributed Acoustic Sensing (DAS) to Improve Lunar Seismic Monitoring
With the appropriate cable selection and deployment, unburied DAS is a viable technique for lunar seismic applications, enabling large-scale measurements without complex installation procedures.
Posted inEditors' Highlights
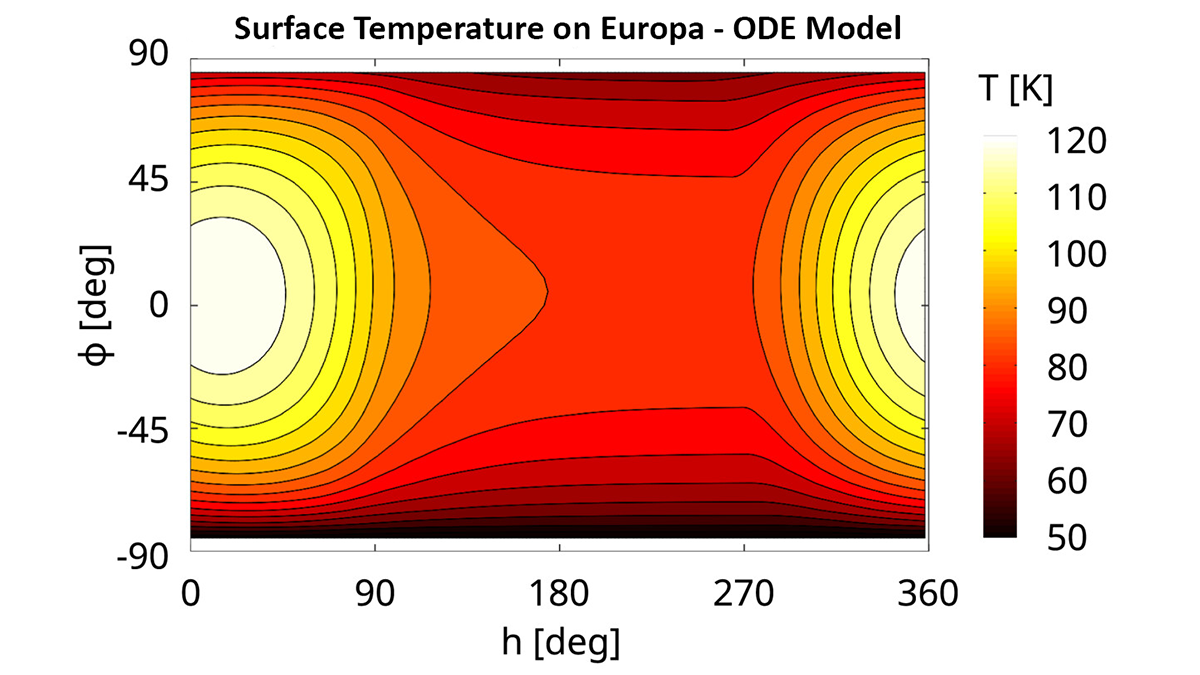
Simplified Noon-Temperature Calculations for Planetary Bodies
By applying simplified equations, scientists cut down on the computation time required to map the surface temperatures of planetary bodies.
Posted inEditors' Highlights
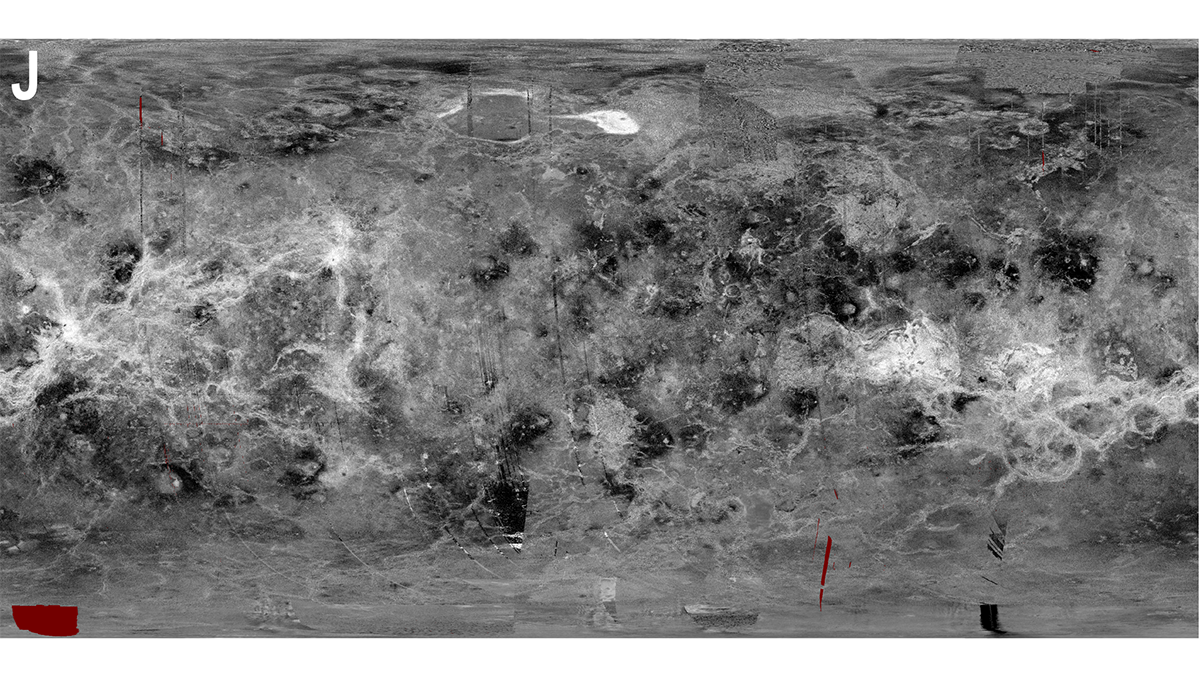
Opening a Treasure Trove: A Trip to the Historic Archives of Venus
Before 1989, pre-Magellan orbiter and ground-based exploration of Venus produced significant datasets that will be useful when planning future missions to the planet.
Posted inEditors' Highlights
Linking Space Weather and Atmospheric Changes With Cosmic Rays
Water-Cherenkov cosmic-ray detectors can be used as a tool for monitoring and studying changes in the lower stratosphere over Antarctica.
Posted inEditors' Highlights
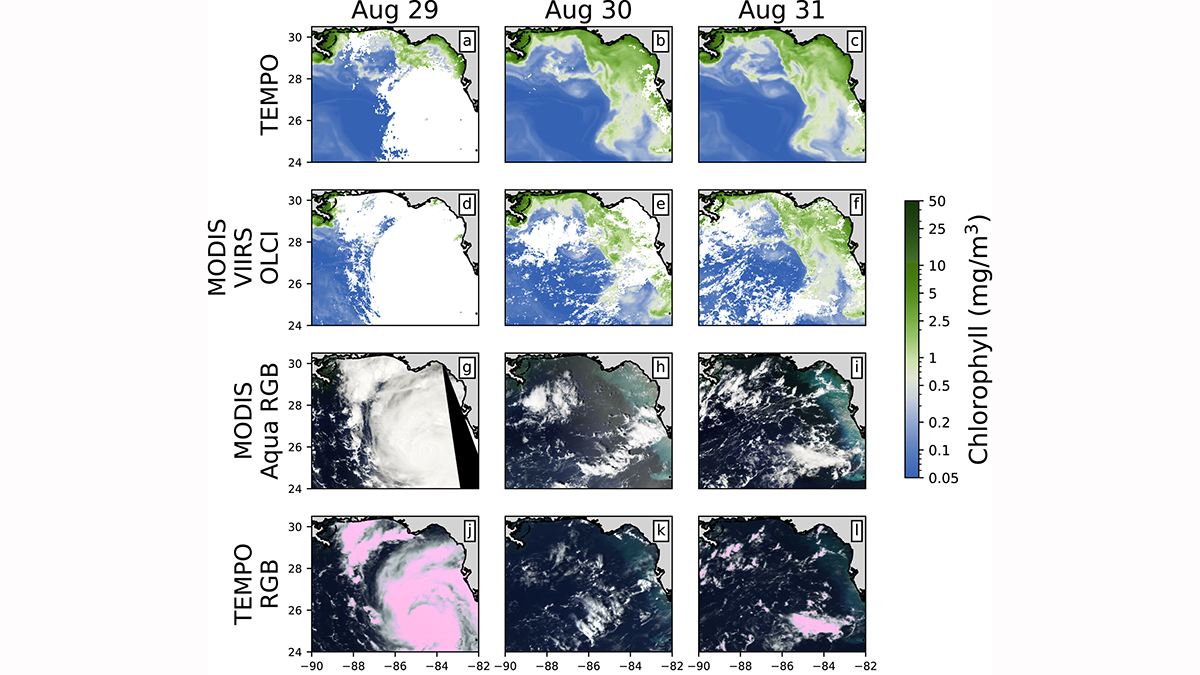
Monitoring Ocean Color From Deep Space: A TEMPO Study
Scientists apply machine learning to demonstrate that geosynchronous satellites can be used to assess the health of oceans from deep space.
Posted inEditors' Vox
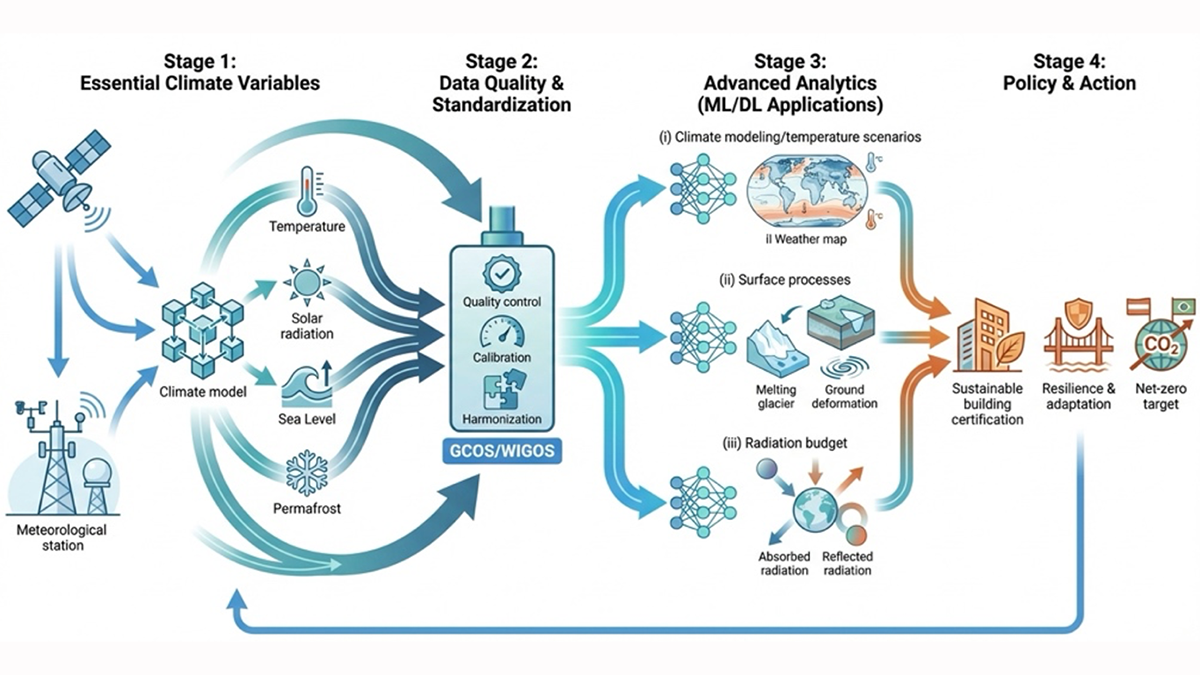
Bridging the Gap: Transforming Reliable Climate Data into Climate Policy
A new special collection welcomes research that bridges the gap between rigorous Essential Climate Variable (ECV) monitoring, AI analytics, and climate policy.
Posted inEditors' Highlights
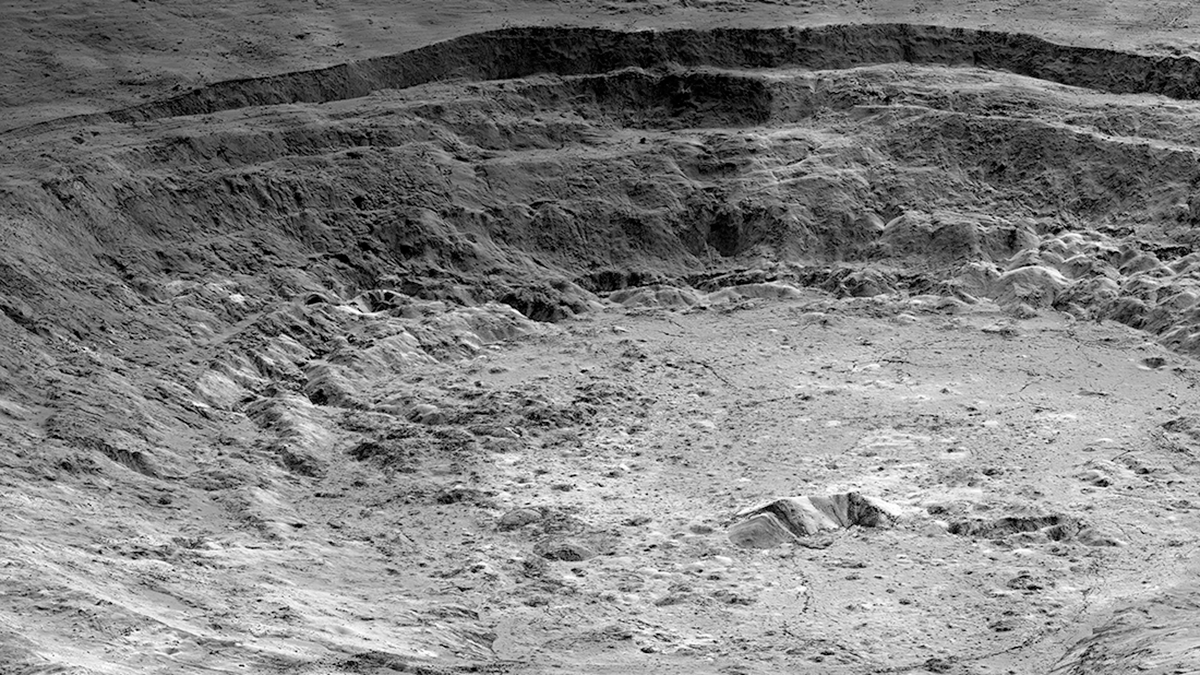
Gravity with an “Edge”: What Lies Beneath Aristarchus Crater
A method combining three different approaches to the processing and analysis of GRAIL data from the Moon defines areas of sharply contrasting densities beneath Aristarchus Crater.
Posted inEditors' Highlights
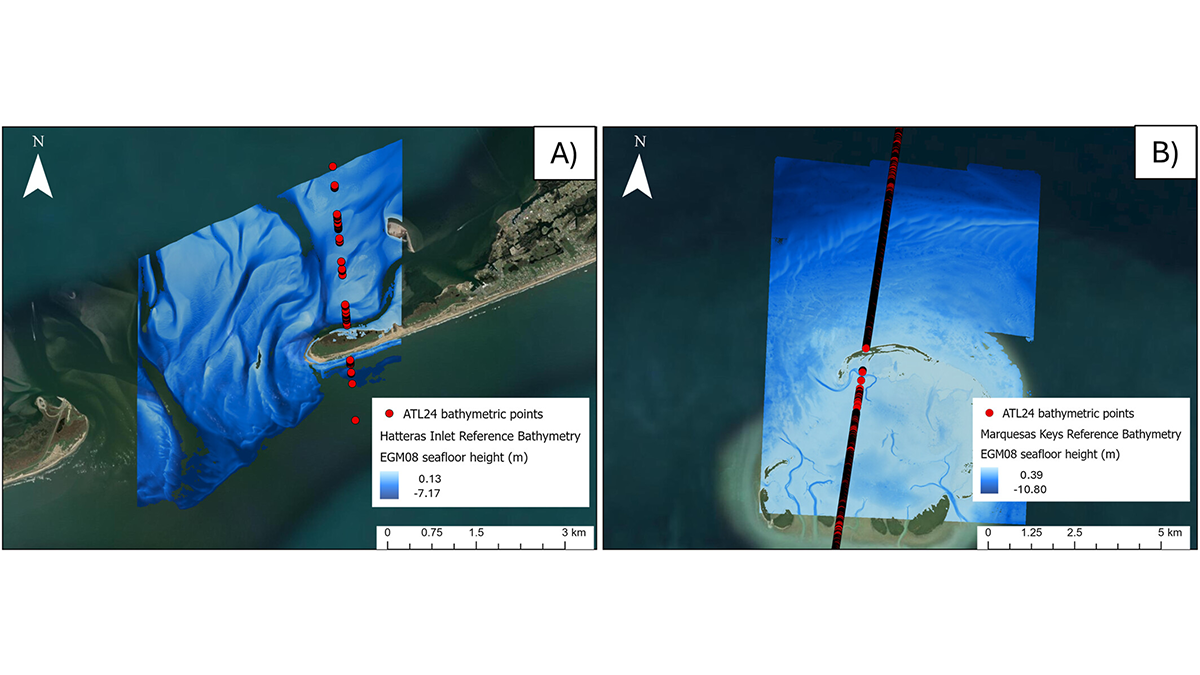
NASA Mission Creates a New Global Coastal Bathymetry Product
NASA’s Ice, Cloud, and land Elevation Satellite 2 (ICESat-2) mission recently released a new shallow water bathymetry product, which has already delivered data for 13.7 million kilometers of coastal waters.
Posted inEditors' Highlights
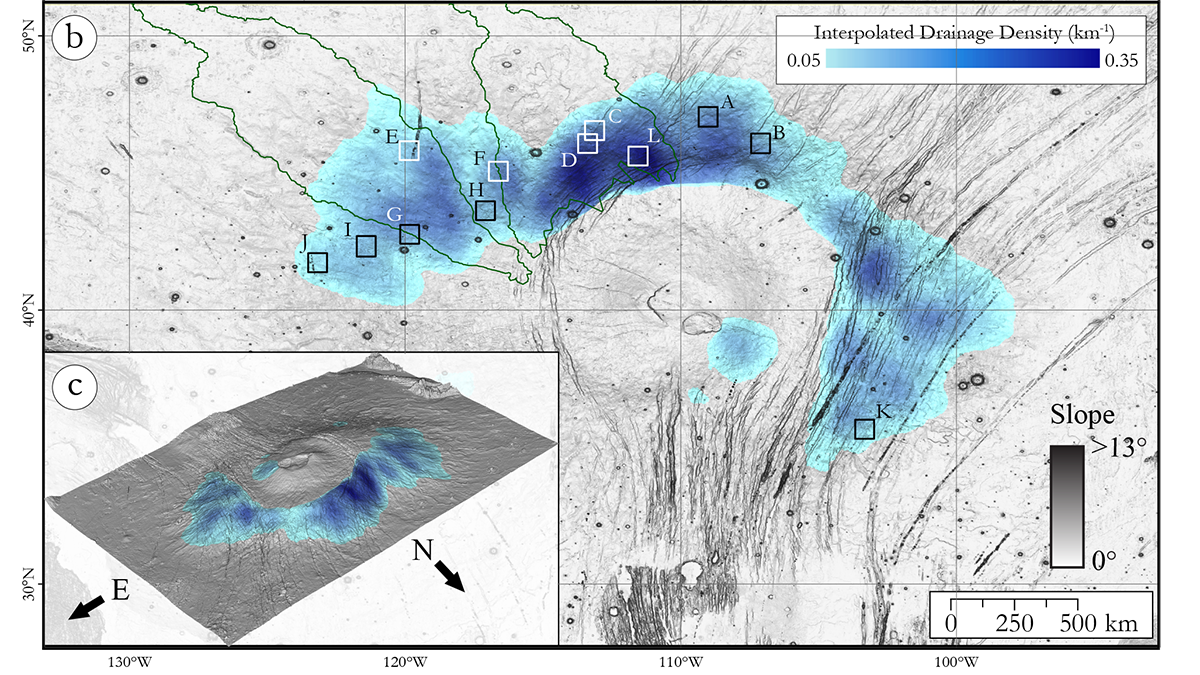
Young Rivers on a Martian Volcano Reveal Insights into the Amazonian Climate
A comprehensive inventory of rivers on Alba Mons on Mars reveals a prolonged history of erosion and development into mature drainage networks during the Amazonian, with contributions of rainfall and snow melt.