
El Niño Southern Oscillation (ENSO) predictability is examined in a new global coupled retrospective forecast ensemble for the 20th Century.
temperature


Posted inNews
Un nuevo enfoque para un misterio sin resolver en la economía climática
¿Tienen los cambios de temperatura impactos económicos duraderos? Un truco “ingenioso” que identifica tendencias climáticas nos lleva un paso más cerca a abordar esta vieja pregunta en la economía climática.

Posted inNews
Major Investment in Air-Conditioning Needed to Address Future Heat Waves
More than 80% of urban residents will need AC by the 2050s, but many of the world’s poorer countries may struggle to meet that demand.
Posted inNews
A New Approach to an Unresolved Mystery in Climate Economics
Do shifts in temperature have enduring economic impacts? A “clever” trick identifying climate trends gets us one step closer to addressing this long-standing question in climate economics.
Posted inEditors' Highlights
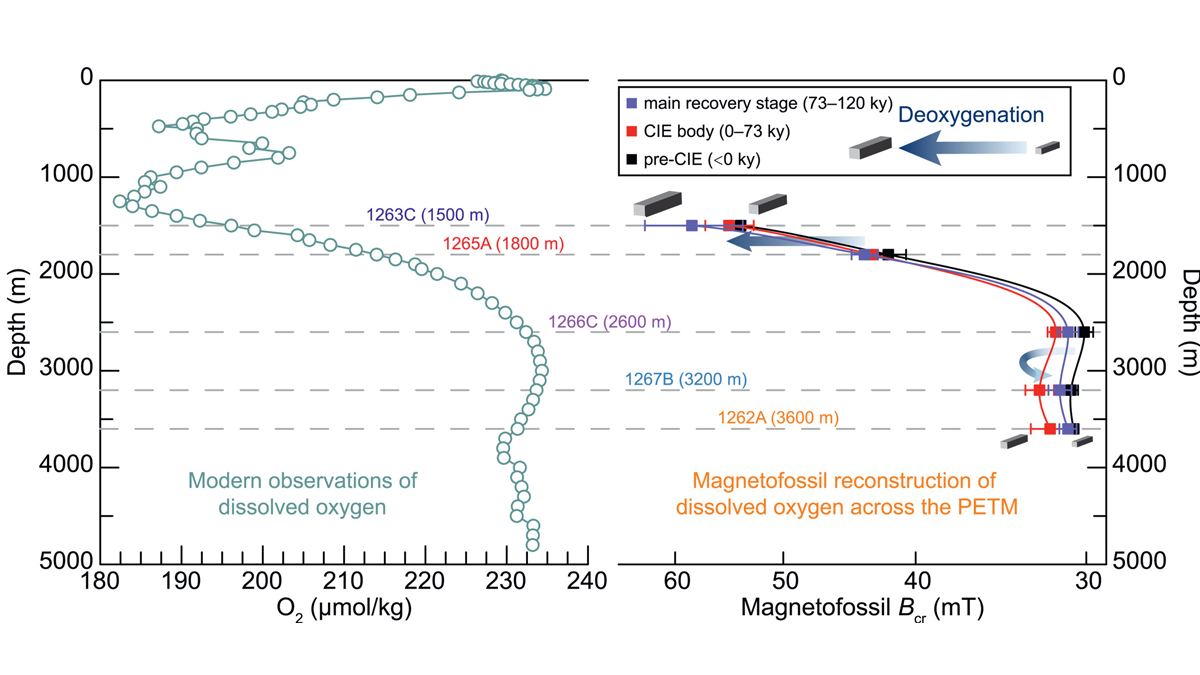
Magnetofossils Unveil Paleoredox Conditions in Extreme Climate
The Paleocene-Eocene Thermal Maximum, a thermal pulse about 56 million years ago, is an analog for future global warming. A new magnetofossil study shows progressive ocean deoxygenation.

Posted inENGAGE, News
Caves Offer Temperate Hope for Future Moon Exploration
Large caves near the Moon’s equator maintain a temperate, stable daily temperature around 17°C.
Posted inResearch Spotlights
Factors in the Severity of Heat Stroke in China
When temperatures exceed 36°C and relative humidity passes 58%, citizens in China may experience heat stroke.
Posted inEditors' Highlights
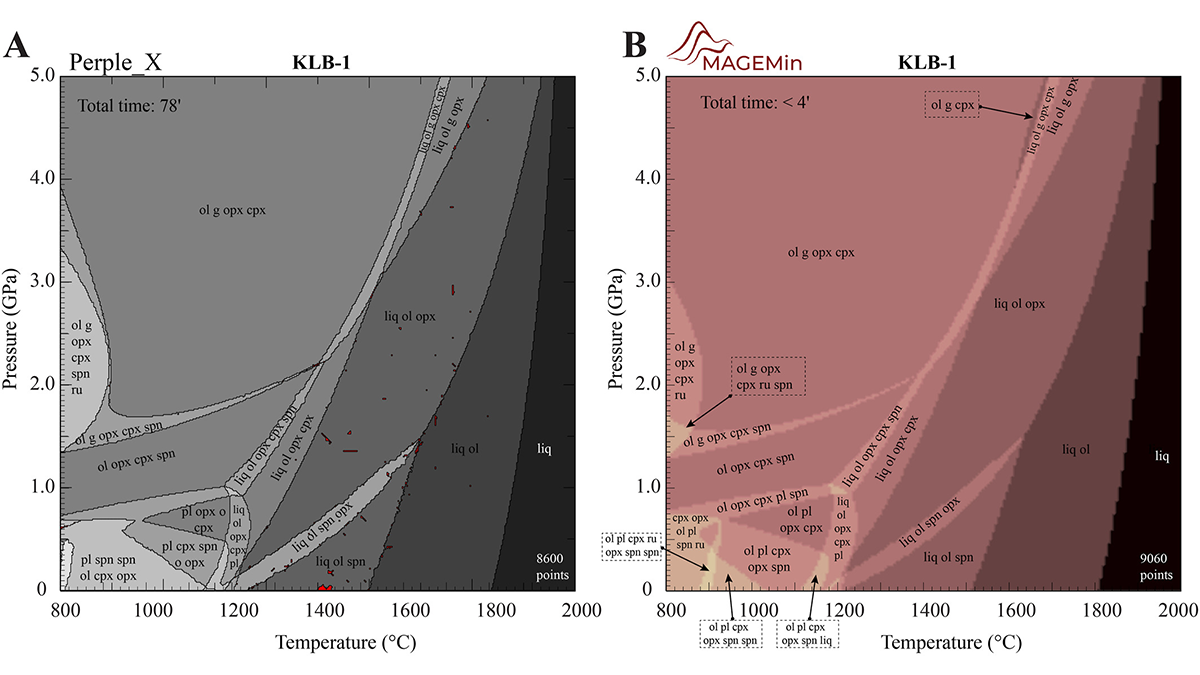
A New, Fast Computational Tool for Magmatic Phase Equilibria
Thermodynamic calculations in multiphase, multicomponent magmatic systems can be slow and buggy. A new parallel architecture solves the free energy minimization problem much faster than alternatives.

Posted inEditors' Highlights
Community Scientists Help to Beat the Heat
As cities face health threats from heat and air pollution—both expected to worsen from climate change—researchers pilot a community scientist effort to map air quality and improve urban health.