The Antarctic summer of 2019–2020 was the largest melt season on record for the George VI ice shelf. But no one could get there to study ice shelf processes because of the COVID-19 pandemic.
Alison Banwell, who had placed cameras and monitors there in November 2019 to capture the filling and draining of a meltwater lake, was one of the sidelined researchers. When she returned 2 years later, after the exceptional melt season and an extra winter of exposure, “lots of the instruments were totally encased in ice,” she said.
But a time-lapse camera survived, providing the first on-the-ground images of ring fractures. These circular cracks in ice shelves had been predicted, simulated, and even observed by satellite, but “until now, no one had any actual in situ evidence of that fracture,” Banwell said.
The research is the latest step by Banwell, a glaciologist at the University of Colorado Boulder, and her colleagues in deciphering what triggers ice shelves to rapidly collapse.
In 2013, the researchers proposed that ring fractures contributed to the Larsen B breakup. In 2019, they published evidence of ice sheets flexing under the weight of meltwater lakes. Now, in the Journal of Glaciology, they’ve shared the first direct observations of meltwater lakes leading to ring fractures.
Flex and Fracture
“The most important fracture in Larsen B was this ring fracture.”
The mechanics of ring fractures are straightforward. As meltwater pools in low points, it weighs down the ice, like a child standing on a trampoline. These lakes grow gradually but can drain quickly. If the water punches through to the ocean below and drains, the ice shelf rebounds rapidly and fractures in the process. That can set off a chain reaction: New ring fractures drain nearby lakes, which trigger further fractures.
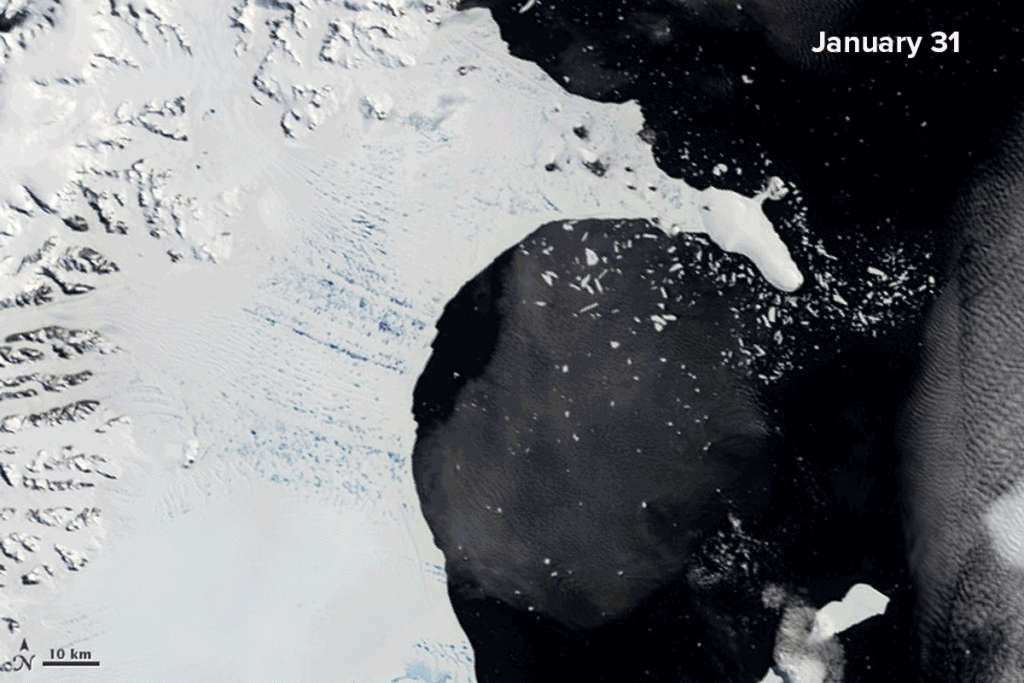
This process may have caused the rapid shattering of the Larsen B ice shelf, a 12,000-year-old slab the size of Rhode Island that disintegrated in just 35 days in 2002. “The most important fracture in Larsen B was this ring fracture,” Banwell said, referring to simulations of the breakup.
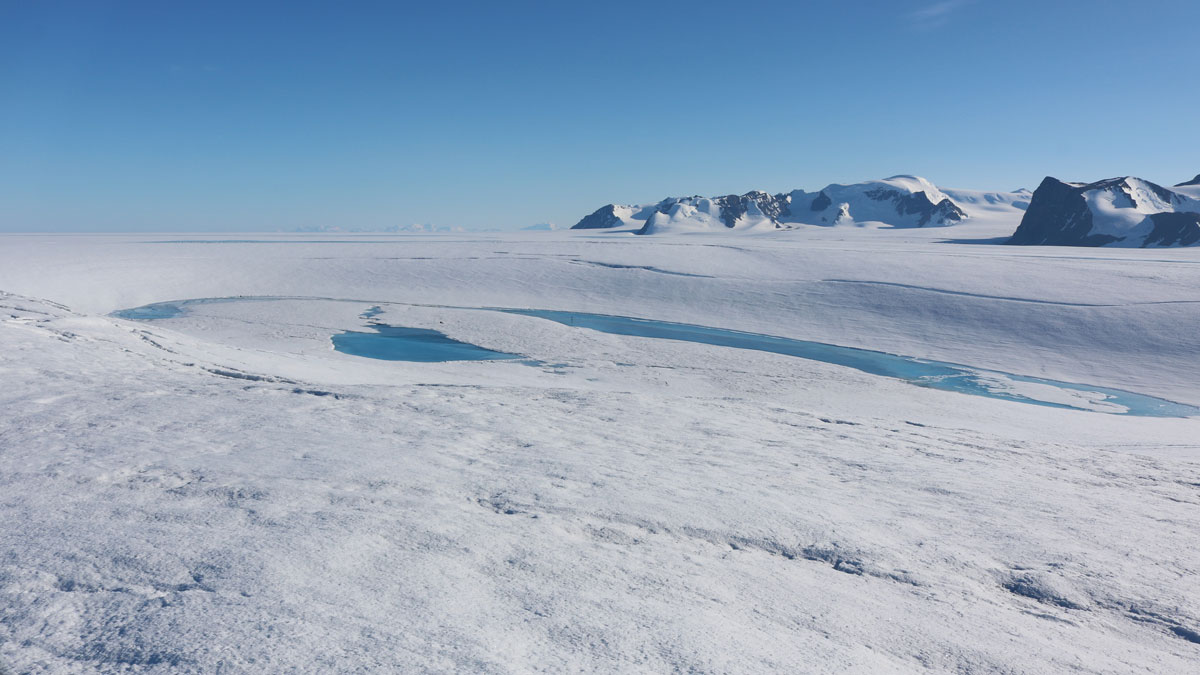
The newly published images of ring fractures come from a doline on the George VI ice shelf, attached to the Antarctic Peninsula. Dolines are drained lake basins that look like massive ice doughnuts, with uplifted rims circling a central depression. As the air temperature warms, the doline fills with meltwater.
Meltwater ponding is unpredictable. But satellite records showed that this bowl-shaped doline persisted through several melt seasons. Even better for researchers, it was close to the British Antarctic Survey’s remote field station on Fossil Bluff.
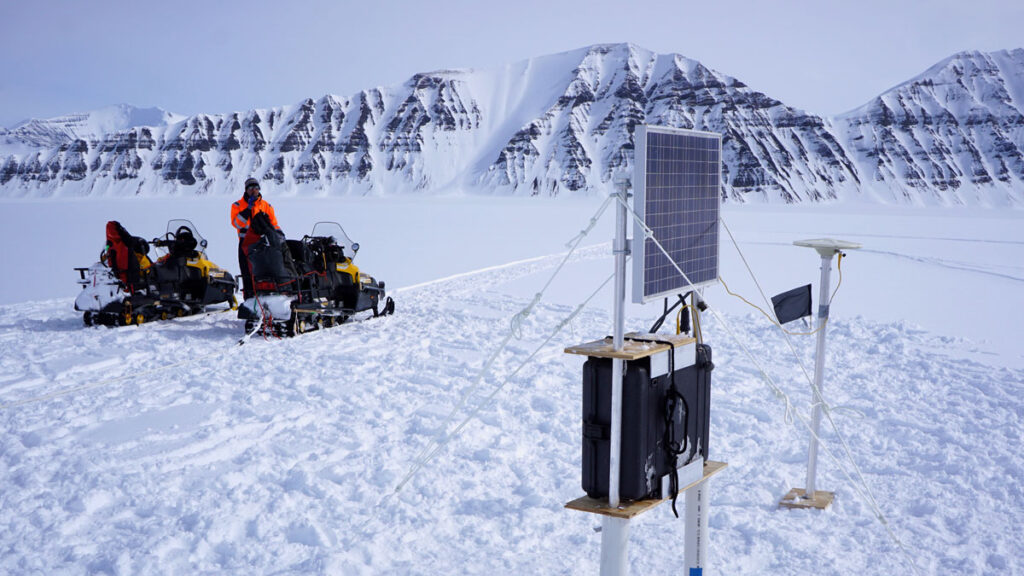
Banwell and her colleagues traveled for more than an hour on tethered snowmobiles to install their monitoring equipment, certain the doline would fill with meltwater again. Their equipment included a camera, four GPS stations, a temperature gauge, and pressure sensors to determine the volume of the anticipated lake.

When they returned after 2 years of pandemic-related travel restrictions, the team could salvage only two GPS stations and the time-lapse camera, which had snapped images every 30 minutes for the first 4.5 months.
The images showed that melting started in early December 2019. Ring fractures appeared by late December, framing the banks of the lake.
Ringing Endorsements
“It’s one data point. But that data point is worth a lot, because it’s the only one of its kind.”
Antarctica’s melting ice shelves can indirectly lead to sea level rise, but simulations of future collapse are needed to know where, when, and how much melting will occur. The new images improve the understanding of ice processes.
On-the-ice observations are essential for simulating ice shelf stability, said Amber Leeson, a glaciologist at Lancaster University in the United Kingdom who was not involved in the research.
Though satellites have recorded ring fractures in the past, “you really need real-world, ground truth examples to constrain the modeling,” she said. This study illuminates the timeline and the magnitude of change that can’t be fully captured by satellites, she added, and helps modelers make predictions based on the best possible understanding of ice physics.
“It’s one data point,” Leeson said of the new study. “But that data point is worth a lot, because it’s the only one of its kind.”
Though most of the research equipment was lost to the ice, the study still provides relevant, useful data, said Lauren Andrews, a glaciologist at NASA Goddard Space Flight Center not involved in the new study.

“This is a really nice example of how straightforward observations can provide insight into ice processes,” she said.
There’s obvious work remaining. The lost pressure sensors would have estimated lake volume, for example.
Also, the relatively stable George VI ice shelf is wedged between two landforms. The process may be different on less constrained sheets such as Larsen B. What is clear is that when meltwater lakes form, ring fractures can follow. Because hundreds of lakes freckled Larsen B, hundreds of ring fractures could have caused the collapse, as Banwell and her colleagues theorized more than a decade ago. The new study “has shown that it’s a very plausible explanation,” Leeson said.
—J. Besl (@J_Besl), Science Writer

