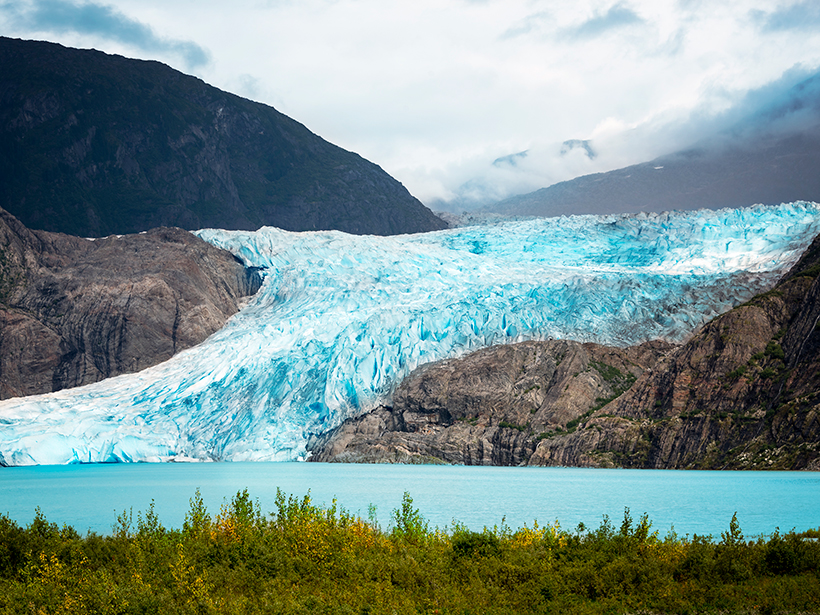
They found that glaciers in southern and central Asia contain, in total, about 50% less ice than previously estimated.
There are hundreds of thousands of glaciers worldwide, and many are a major source of fresh water for agriculture. But estimates of both freshwater resources and sea level rise, a by-product of glacial melting, critically hinge on knowing individual glaciers’ thicknesses, data that have been largely lacking. Now researchers have calculated the thicknesses of all of Earth’s nonpolar glaciers on the basis of ice flow dynamics inferred from satellite imagery. They found that glaciers in southern and central Asia contain, in total, about 50% less ice than previously estimated. That’s an unsettling result given the importance of glacial runoff for agriculture in this region, the scientists concluded.
215,000 Glaciers
The thickness of a glacier can be measured using ground-penetrating radar, but this method is laborious and must be applied to individual glaciers. To conduct a census of a large number of glaciers—each of the roughly 215,000 in the Randolph Glacier Inventory—Daniel Farinotti, a glaciologist at Eidgenössische Technische Hochschule Zurich in Switzerland and the Swiss Federal Institute for Forest, Snow and Landscape Research, and his colleagues clearly needed a more efficient technique. The researchers turned to existing models that predicted ice thickness on the basis of satellite-derived glacial topography and ice dynamics: Thicker glaciers tend to flow faster. Farinotti and his collaborators applied up to five different models to each glacier and averaged the results, weighted according to their performance, to reduce the uncertainties associated with relying on just one model.
Farinotti and his colleagues also calculated an ice volume for each glacier by multiplying its area by its thickness. Nonpolar glaciers worldwide have a total ice volume of about 158,000 cubic kilometers, the researchers estimated. That’s enough ice to bury the entire state of California in a layer 400 meters deep.
Less Ice in High Mountain Asia
When the scientists compared their data with previously published values for glaciers in 19 geographical regions, they found striking differences. The largest discrepancy was in High Mountain Asia, a term that encompasses both southern and central Asia and includes countries adjoining the Tibetan Plateau. Farinotti and his colleagues recovered a total ice volume in High Mountain Asia that was 46% lower than the average of previous studies. They attribute this significant difference to advances in satellite imagery, which made it possible to better resolve individual glaciers. “There’s better satellite data,” said Farinotti.
“In light of the importance of glacier melt for the regional water supply, these differences are unsettling.”
The implications of a smaller total ice volume in High Mountain Asia will be felt in the coming decades, the researchers suggest. Glacier evolution modeling with these new results suggests that 50% of the glacial area in High Mountain Asia will be gone by the mid-2060s rather than the late 2070s, as predicted by previous estimates. And simulations of glacial discharge with the new data are similarly worrying: Summertime runoff rates near the end of the 21st century will be roughly 6 billion cubic meters lower per month. “In light of the importance of glacier melt for the regional water supply, these differences are unsettling,” the authors concluded in their study, which was published this week in Nature Geoscience.
These new results are important for a variety of calculations ranging from estimates of local and regional water availability to global mean sea level rise, said Georg Kaser, a glaciologist at the University of Innsbruck in Austria not involved in the research. “Knowing the mass of ice stored in glaciers is crucial for projecting any future development of glaciers.”
—Katherine Kornei ([email protected]; @katherinekornei), Freelance Science Journalist
Citation:
Kornei, K. (2019), Glacial census reveals ice thicknesses around the world, Eos, 100, https://doi.org/10.1029/2019EO116153. Published on 12 February 2019.
Text © 2019. The authors. CC BY-NC-ND 3.0
Except where otherwise noted, images are subject to copyright. Any reuse without express permission from the copyright owner is prohibited.

