On land, it’s easy for us to see divisions between ecosystems: A rain forest’s fan palms and vines stand in stark relief to the cacti of a high desert. Without detailed data or scientific measurements, we can tell a distinct difference in the ecosystem’s flora and fauna.
But how do scientists draw those divisions in the ocean? A new paper proposes a tool to redraw the lines that define an ocean’s ecosystems, lines originally penned by the seagoing oceanographer Alan Longhurst in the 1990s. The paper uses unsupervised learning, a machine learning method, to analyze the complex interplay between plankton species and nutrient fluxes. As a result, the tool could give researchers a more flexible definition of ecosystem regions.
Using the tool on global modeling output suggests that the ocean’s surface has more than 100 different regions or as few as 12 if aggregated, simplifying the 56 Longhurst regions. The research could complement ongoing efforts to improve fisheries management and satellite detection of shifting plankton under climate change. It could also direct researchers to more precise locations for field sampling.
Beyond the Human Eye
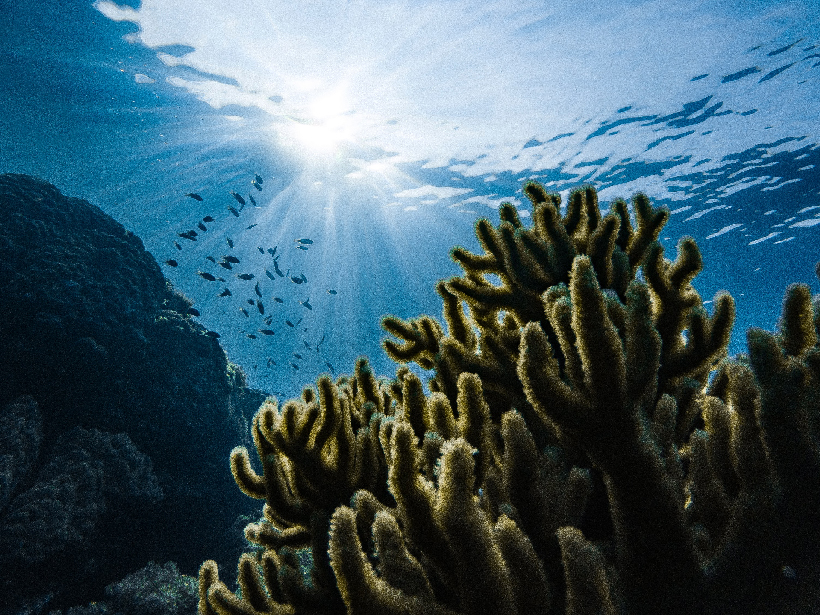
Coccolithophores, diatoms, zooplankton, and other planktonic life-forms float on much of the ocean’s sunlit surface. Scientists monitor plankton with long-term sampling stations and peer at their colors by satellite from above, but they don’t have detailed maps of where plankton lives worldwide.
Models help fill the gaps in scientists’ knowledge, and the latest research relies on an ocean model to simulate where 51 types of plankton amass on the surface oceans worldwide. The latest research then applies the new classification tool, called the systematic aggregated ecoprovince (SAGE) method, to discern where neighborhoods of like-minded plankton and nutrients appear.
“While my human eyes can’t see these different regions that stand out, the machine can. And that’s where the power of this method comes in.”
SAGE relies, in part, on a type of machine learning algorithm called unsupervised learning. The algorithm’s strength is that it searches for patterns unprompted by researchers.
To compare the tool to a simple example, if scientists told an algorithm to identify shapes in photographs like circles and squares, the researchers could “supervise” the process by telling the computer what a square and circle looked like before it began. But in unsupervised learning, the algorithm has no prior knowledge of shapes and will sift through many images to identify patterns of similar shapes itself.
Using an unsupervised approach gives SAGE the freedom to let patterns emerge that the scientists might not otherwise see.
“While my human eyes can’t see these different regions that stand out, the machine can,” first author and physical oceanographer Maike Sonnewald at Princeton University said. “And that’s where the power of this method comes in.” This method could be used more broadly by geoscientists in other fields to make sense of nonlinear data, said Sonnewald.
Desert of the Ocean
Applying SAGE to model data, the tool noted 115 distinct ecological provinces, which can then be boiled down into 12 overarching regions.
One region appears in the center of nutrient-poor ocean gyres, whereas other regions show productive ecosystems along the coast and equator.
“You have regions that are kind of like the regions you’d see on land,” Sonnewald said. One area in “the heart of a desert-like region of the ocean” is characterized by very small cells. “There’s just not a lot of plankton biomass.” The region that includes Peru’s fertile coast, however, has “a huge amount of stuff.”
If scientists want more distinctions between communities, they can adjust the tool to see the full 115 regions. But having only 12 regions can be powerful too, said Sonnewald, because it “demonstrates the similarities between the different [ocean] basins.” The tool was published in a recent paper in the journal Science Advances.
Oceanographer Francois Ribalet at the University of Washington, who was not involved in the study, hopes to apply the tool to field data when he takes measurements on research cruises. He said identifying unique provinces gives scientists a hint of how ecosystems could react to changing ocean conditions.
“If we identify that an organism is very sensitive to temperature, so then we can start to actually make some predictions,” Ribalet said. Using the tool will help him tease out an ecosystem’s key drivers and how it may react to future ocean warming.
—Jenessa Duncombe (@jrdscience), Staff Writer
Citation:
Duncombe, J. (2020), How machine learning redraws the map of ocean ecosystems, Eos, 101, https://doi.org/10.1029/2020EO143038. Published on 02 June 2020.
Text © 2020. AGU. CC BY-NC-ND 3.0
Except where otherwise noted, images are subject to copyright. Any reuse without express permission from the copyright owner is prohibited.
Text © 2020. AGU. CC BY-NC-ND 3.0
Except where otherwise noted, images are subject to copyright. Any reuse without express permission from the copyright owner is prohibited.