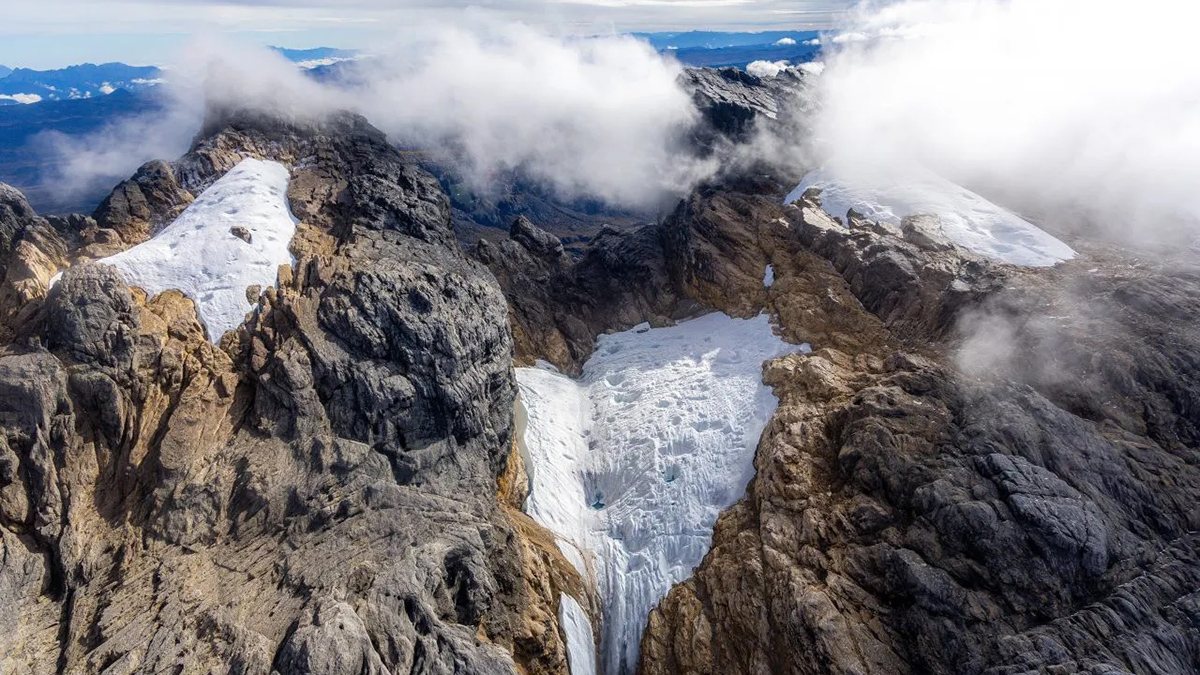
• About
  • Special Reports
  • Topics
    • Climate
    • Earth Science
    • Oceans
    • Space & Planets
    • Health & Ecosystems
    • Culture & Policy
    • Education & Careers
    • Opinions
  • Projects
    • Postcards From the Field
    • ENGAGE
    • Editors’ Highlights
    • Editors’ Vox
    • Eos en Español
    • Eos 简体中文版
    • Print Archive: 2015–2025
  • Policy Tracker
  • Blogs
    • Research & Developments
    • The Landslide Blog
  • Newsletter
  • Submit to Eos
  • AGU.org
  • Career Center
  • Join AGU
  • Give to AGU
  • About
  • Special Reports
  • Topics
    • Climate
    • Earth Science
    • Oceans
    • Space & Planets
    • Health & Ecosystems
    • Culture & Policy
    • Education & Careers
    • Opinions
  • Projects
    • Postcards From the Field
    • ENGAGE
    • Editors’ Highlights
    • Editors’ Vox
    • Eos en Español
    • Eos 简体中文版
    • Print Archive: 2015–2025
  • Policy Tracker
  • Blogs
    • Research & Developments
    • The Landslide Blog
  • Newsletter
  • Submit to Eos
Skip to content
  • AGU.org
  • Career Center
  • Join AGU
  • Give to AGU
Eos

Eos

Science News by AGU

Support Eos
Sign Up for Newsletter
  • About
  • Special Reports
  • Topics
    • Climate
    • Earth Science
    • Oceans
    • Space & Planets
    • Health & Ecosystems
    • Culture & Policy
    • Education & Careers
    • Opinions
  • Projects
    • Postcards From the Field
    • ENGAGE
    • Editors’ Highlights
    • Editors’ Vox
    • Eos en Español
    • Eos 简体中文版
    • Print Archive: 2015–2025
  • Policy Tracker
  • Blogs
    • Research & Developments
    • The Landslide Blog
  • Newsletter
  • Submit to Eos

mapping

A clear tree line is visible on a mountain range.
Posted inNews

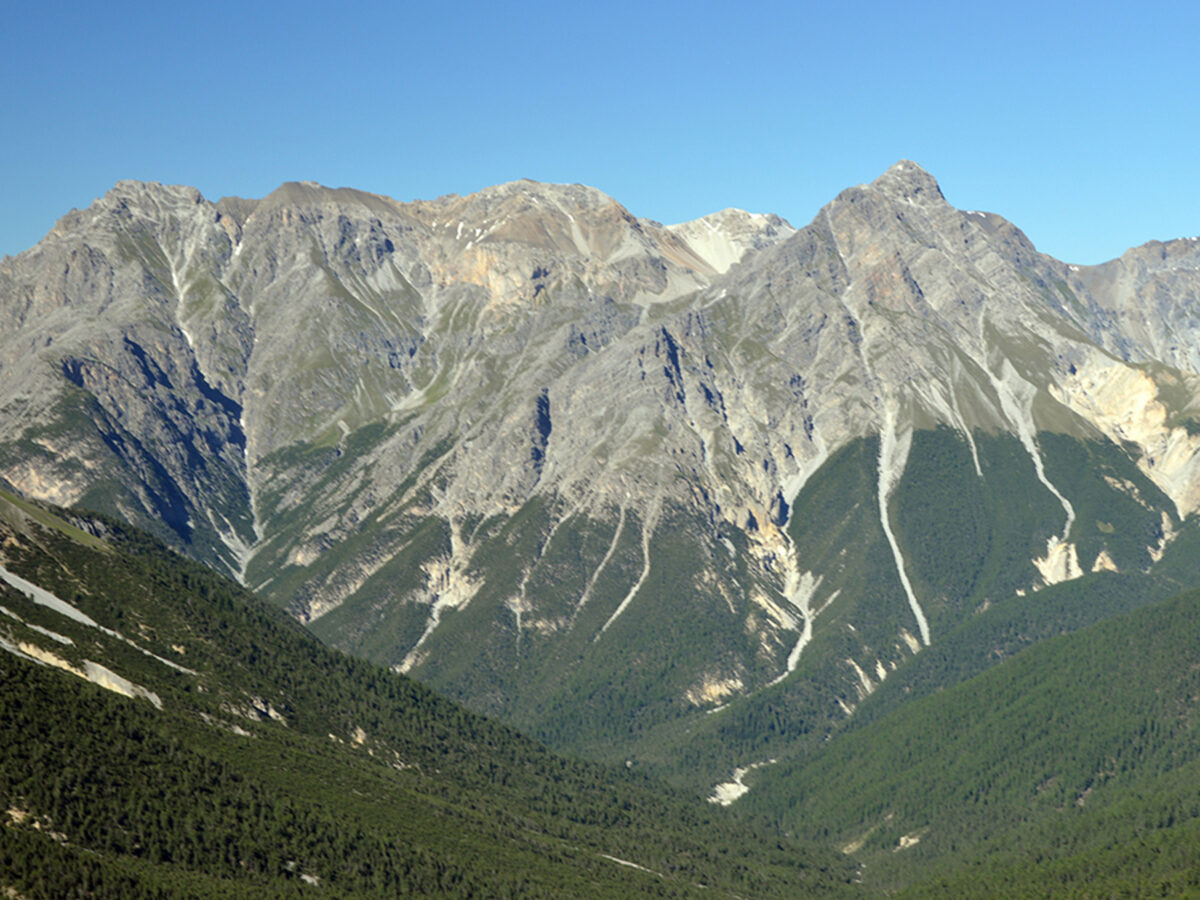
Tree Lines Are Migrating. Some Up, Some Down.

by Emily Gardner 12 May 202612 May 2026

Between 2000 and 2020, 42% of tree lines around the world crept upward, largely because of climate change. But 25% moved downhill, seemingly because of factors such as land use changes and wildfires.

Industrial facilities cover a small island, with gray-blue water in the foreground.
Posted inNews

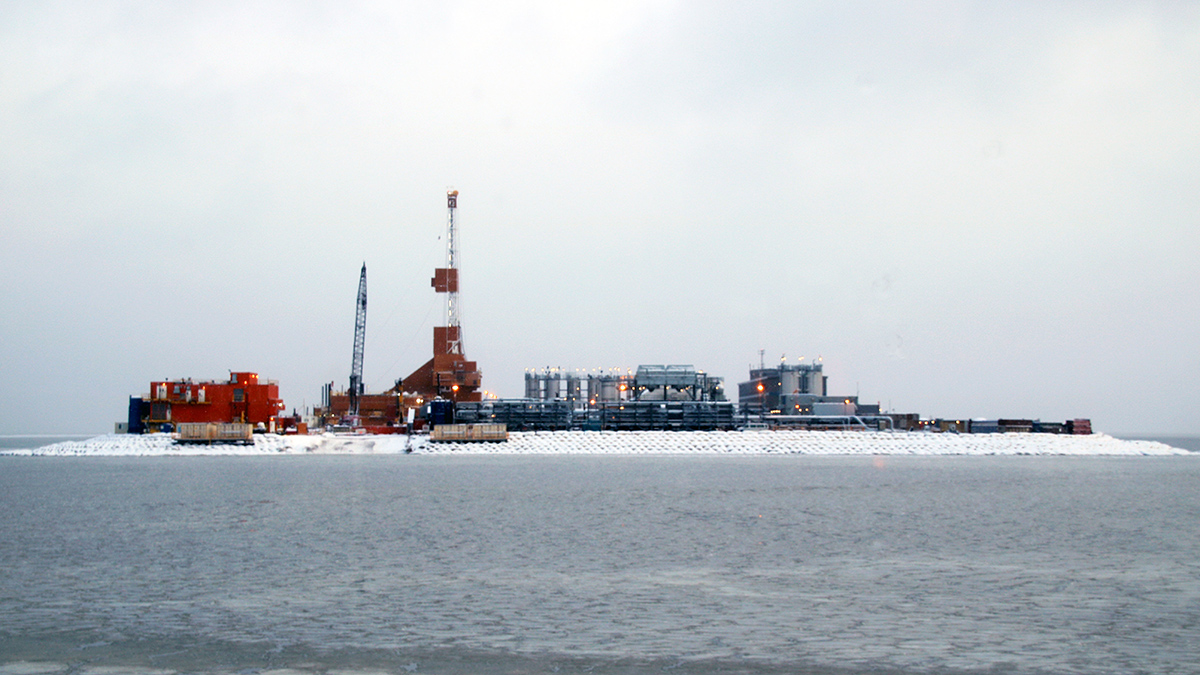
This Arctic Atlas Shows Where Oil and Gas Activities Overlap with Wildlife and Indigenous Communities

by Grace van Deelen 7 May 20267 May 2026

To slow climate change, the world must keep its fossil fuels in the ground. New maps of Arctic activities show where resources should stay put.

A bridge crosses a river beneath a relatively short waterfall. A city skyline is on the other side of the river.
Posted inResearch & Developments

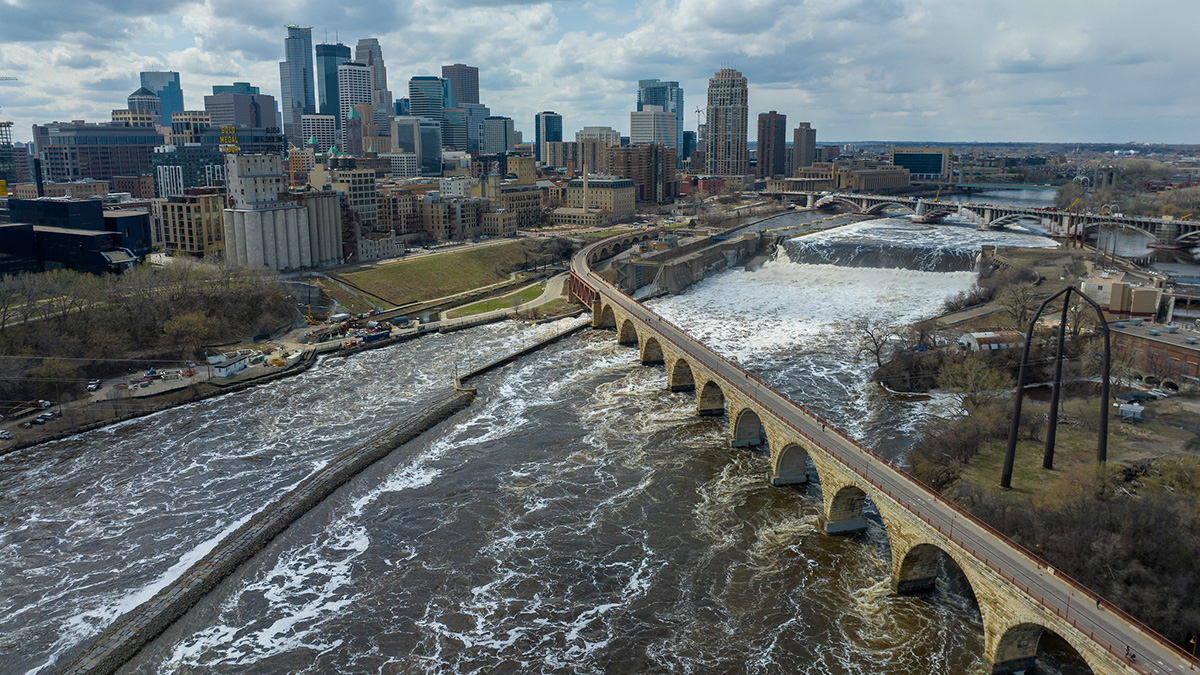
New USGS Tool Fills in the Gaps on U.S. Water Supply

by Emily Dieckman 29 April 202629 April 2026

The National Water Availability Assessment Data Companion is the first tool that integrates information about water availability in individual watersheds at a national scale.

Two maps of Earth show areas highlighted in red and blue. In the image called “nonelliptical geoid,” the darkest blue area is in the Indian Ocean. In the image labeled “nonhydrostatic geoid,” the darkest blue area is over Antarctica.
Posted inNews

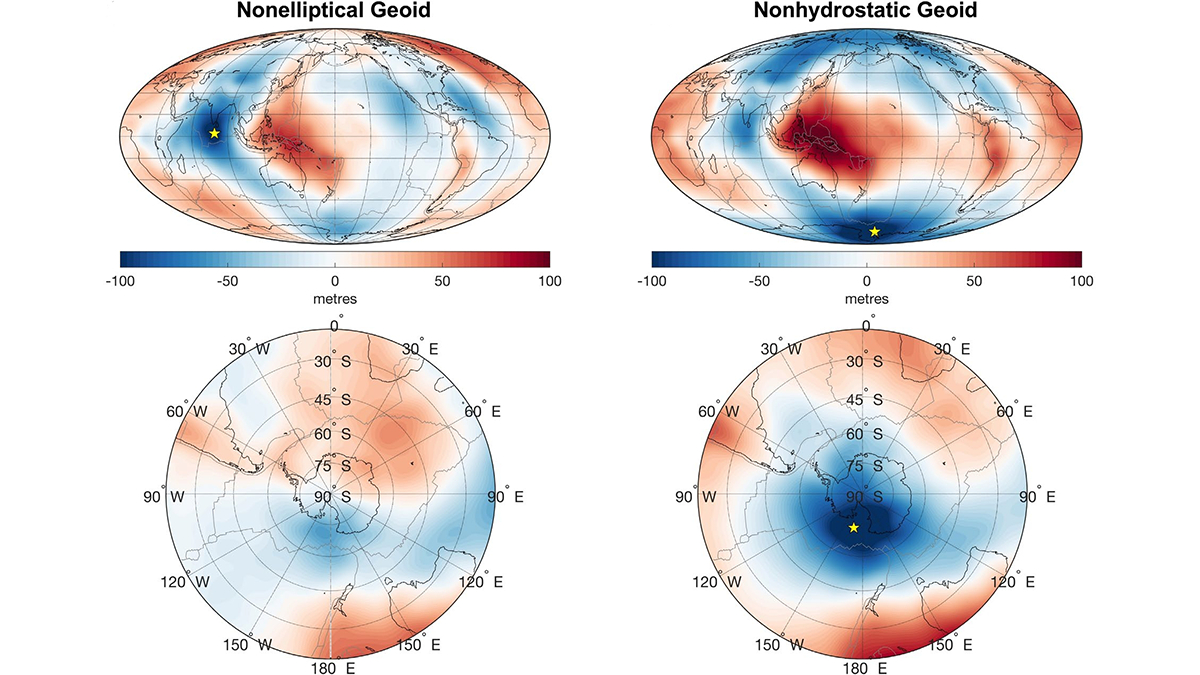
Scientists Remap Earth’s Gravity

by Tom Metcalfe 26 March 202626 March 2026

An uncommon way of looking at the world reveals the evolution of a deep gravity hole beneath Antarctica.

An aerial photo shows a green landscape with a large rock formation in the distance at sunset.
Posted inNews

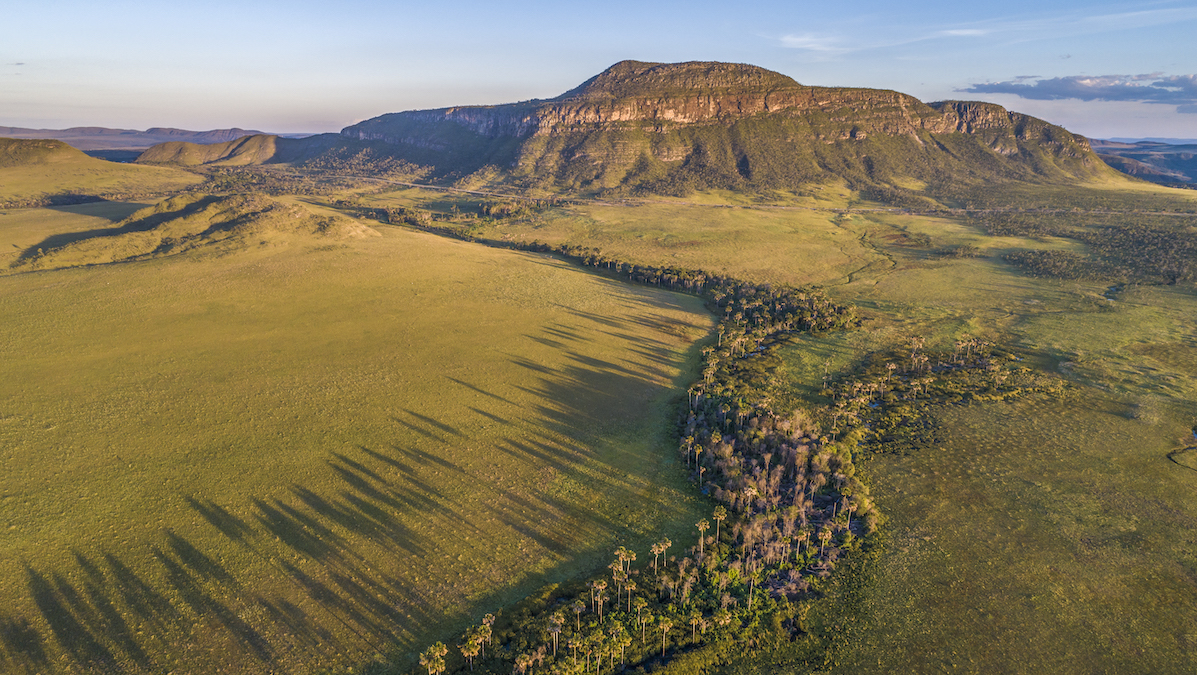
These Underprotected Brazilian Wetlands Store Carbon with Staggering Density

by Grace van Deelen 12 March 202612 March 2026

The Cerrado, largely overlooked in climate science and policy, is a critical carbon sink, according to new research.

A map showing continental mantle earthquakes around the world.
Posted inNews

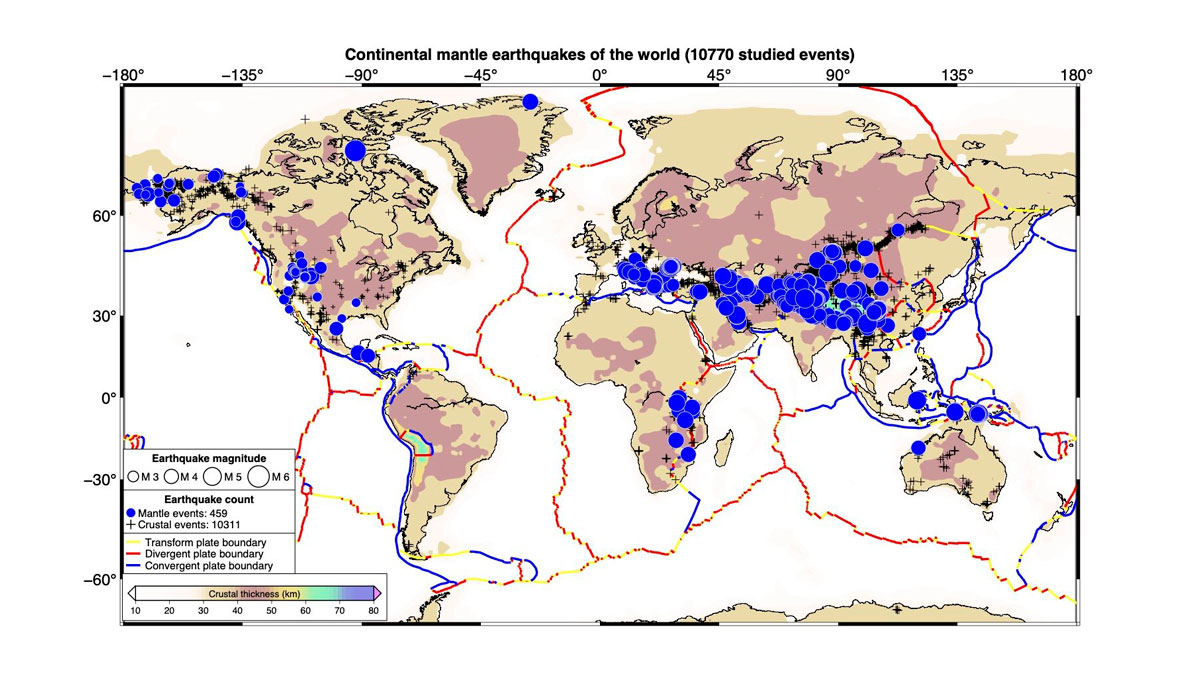
Scientists Create the First Map of Deep Earthquakes Beneath Continents

by Larissa G. Capella 5 March 20265 March 2026

Scientists once thought Earth’s continental mantle was too weak for earthquakes. A new global map of 459 deep tremors suggests otherwise.

Roughly a quarter of a crater rim with blue-white streaks pointed inward.
Posted inNews

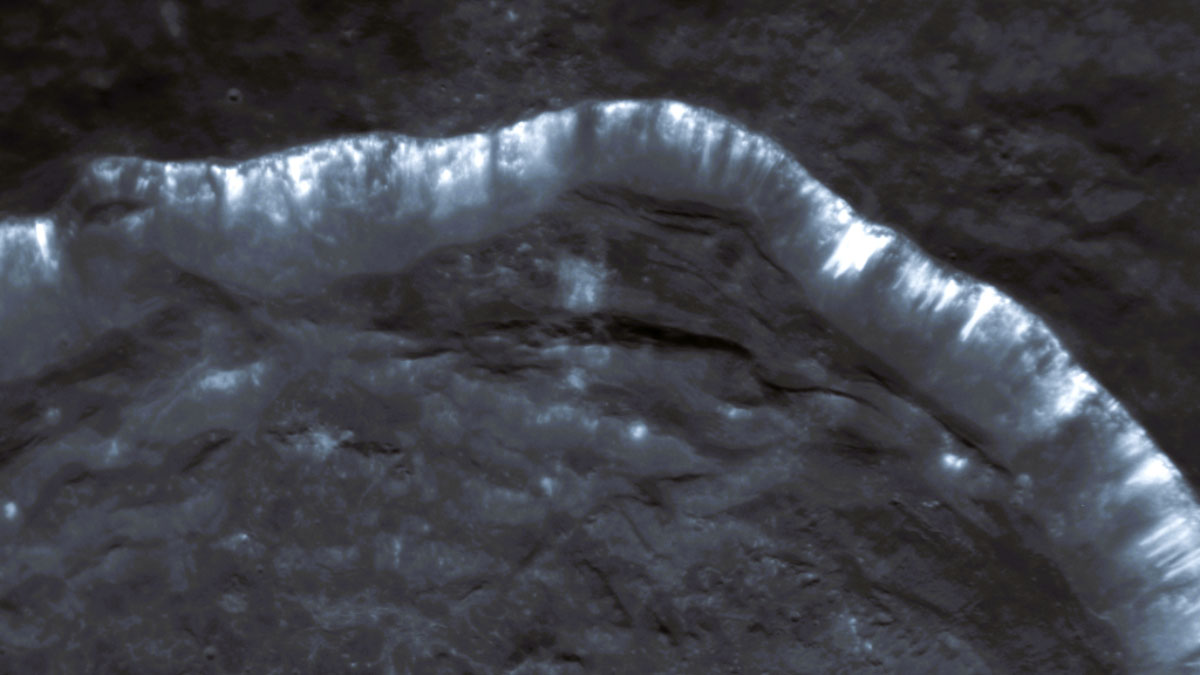
Oozing Gas Could Be Making Stripes in Mercury’s Craters

Kimberly M. S. Cartier, News Writing and Production Intern for Eos.org by Kimberly M. S. Cartier 12 February 202612 February 2026

Scientists are using new computational tools to analyze troves of old spacecraft data to better understand one of Mercury’s unsolved mysteries.

A geographic information system (GIS) map shows a number of different layers: Blue areas represent flood zones or floodways, whereas white areas are those with minimal flood hazard. Red, orange, green, and gray areas represent mining waste.
Posted inResearch Spotlights

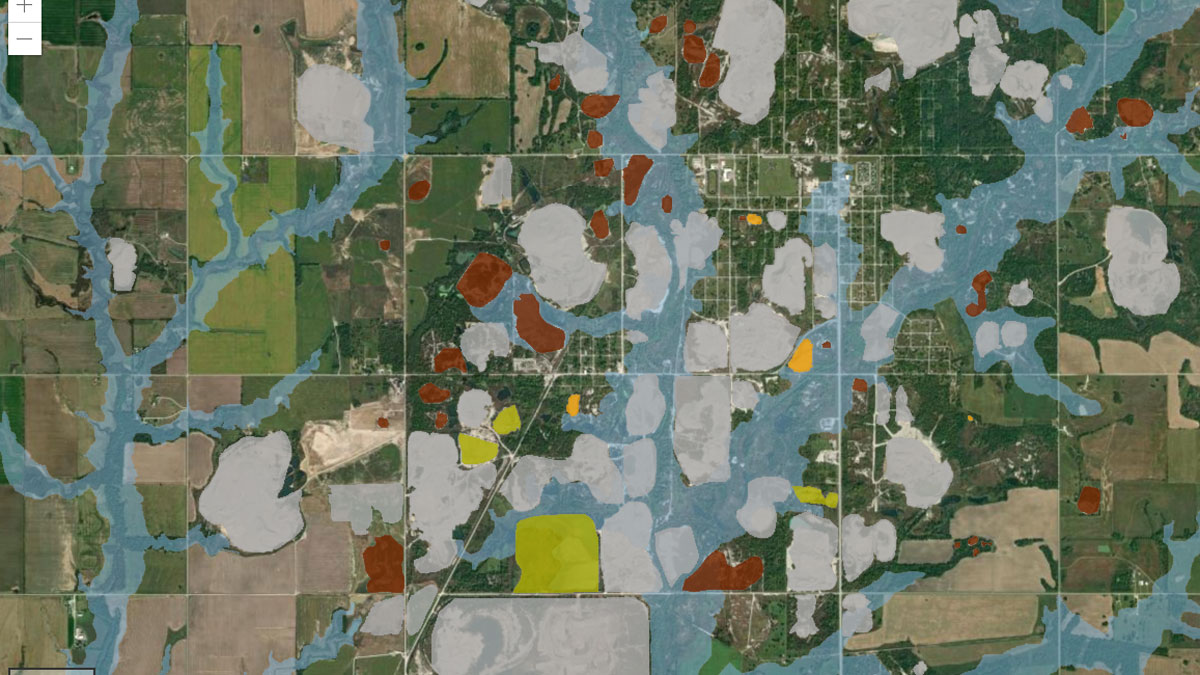
Making a Map to Make a Difference

by Rebecca Owen 11 February 202611 February 2026

A new study highlights the partnership between scientists and nonscientist community members in building an interactive GIS map to show flooding risk in a Superfund site.

Two people wearing purple latex gloves stand in a field where the grass is up to their waists. One steps on a shovel to push it into the ground, and the other holds an orange bucket.
Posted inNews

Nationwide Soil Microbiome Mapping Project Connects Students and Scientists

by Rebecca Owen 3 February 20263 February 2026

Researchers and students are building a comprehensive picture of the microbial life beneath our feet.

A map of the contiguous United States shows the depth of the water table in different areas.
Posted inNews

Report: 13 Great Lakes’ Worth of Water Underlies the Contiguous United States

by Emily Gardner 26 January 202626 January 2026

Researchers used 1 million data points and a machine learning algorithm to estimate groundwater stores with higher resolution than ever before.

Posts pagination

1 2 3 … 24 Older posts
Over a dark blue-green square appear the words Special Report: The State of the Science 1 Year On.

Features from AGU Publications

Research Spotlights

How Much Will Western Wildfires Worsen Under Warming?

15 May 202615 May 2026
Editors' Highlights

Small and Large Grains Move Differently in Water

18 May 202618 May 2026
Editors' Vox

The Impact of Advocacy: American Geophysical Union’s Days of Action

14 May 202613 May 2026
Eos logo at left; AGU logo at right

About Eos
ENGAGE
Awards
Contact

Advertise
Submit
Career Center
Sitemap

© 2026 American Geophysical Union. All rights reserved Powered by Newspack