• About
  • Special Reports
  • Topics
    • Climate
    • Earth Science
    • Oceans
    • Space & Planets
    • Health & Ecosystems
    • Culture & Policy
    • Education & Careers
    • Opinions
  • Projects
    • Postcards From the Field
    • ENGAGE
    • Editors’ Highlights
    • Editors’ Vox
    • Eos en Español
    • Eos 简体中文版
    • Print Archive: 2015–2025
  • Policy Tracker
  • Blogs
    • Research & Developments
    • The Landslide Blog
  • Newsletter
  • Submit to Eos
  • AGU.org
  • Career Center
  • Join AGU
  • Give to AGU
  • About
  • Special Reports
  • Topics
    • Climate
    • Earth Science
    • Oceans
    • Space & Planets
    • Health & Ecosystems
    • Culture & Policy
    • Education & Careers
    • Opinions
  • Projects
    • Postcards From the Field
    • ENGAGE
    • Editors’ Highlights
    • Editors’ Vox
    • Eos en Español
    • Eos 简体中文版
    • Print Archive: 2015–2025
  • Policy Tracker
  • Blogs
    • Research & Developments
    • The Landslide Blog
  • Newsletter
  • Submit to Eos
Skip to content
  • AGU.org
  • Career Center
  • Join AGU
  • Give to AGU
Eos

Eos

Science News by AGU

Support Eos
Sign Up for Newsletter
  • About
  • Special Reports
  • Topics
    • Climate
    • Earth Science
    • Oceans
    • Space & Planets
    • Health & Ecosystems
    • Culture & Policy
    • Education & Careers
    • Opinions
  • Projects
    • Postcards From the Field
    • ENGAGE
    • Editors’ Highlights
    • Editors’ Vox
    • Eos en Español
    • Eos 简体中文版
    • Print Archive: 2015–2025
  • Policy Tracker
  • Blogs
    • Research & Developments
    • The Landslide Blog
  • Newsletter
  • Submit to Eos

M. J. Brodzik

Microwave brightness temperature maps derived from satellite data.
Posted inScience Updates

Bringing Earth's Microwave Maps into Sharper Focus

by A. C. Paget, M. J. Brodzik, D. G. Long and M. A. Hardman 21 December 201631 March 2023

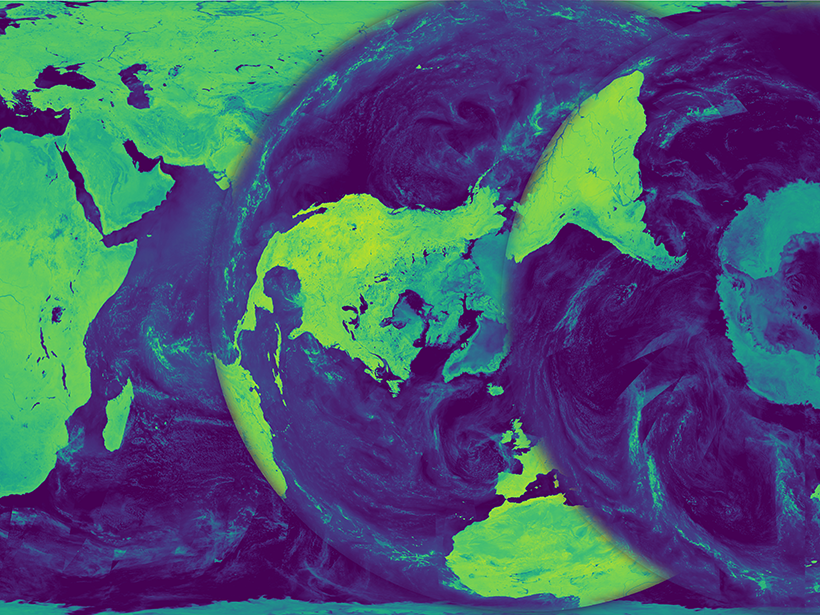
New processing capabilities improve the spatial resolution of satellite microwave data, enabling scientists to analyze trends in coastal regions and marginal ice zones.

Over a dark blue-green square appear the words Special Report: The State of the Science 1 Year On.

Features from AGU Publications

Research Spotlights

A Long-Term Look Beneath an Antarctic Ice Shelf

6 March 20266 March 2026
Editors' Highlights

Tropopause Temperature Drives Tropical Cyclone Simulation Diversity

6 March 20266 March 2026
Editors' Vox

Editorial Handover at Perspectives of Earth and Space Scientists

6 March 20266 March 2026
Eos logo at left; AGU logo at right

About Eos
ENGAGE
Awards
Contact

Advertise
Submit
Career Center
Sitemap

© 2026 American Geophysical Union. All rights reserved Powered by Newspack