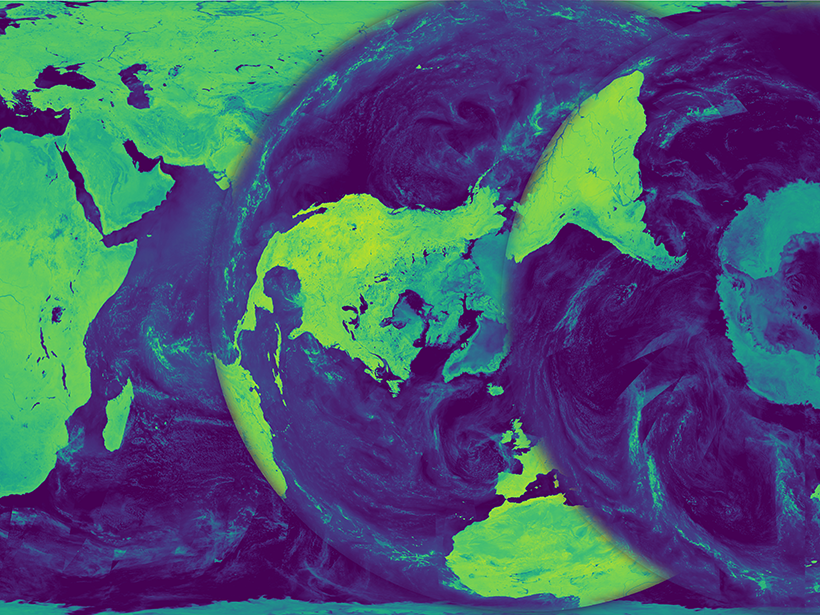
Since the launch of the first passive microwave radiometers in the 1970s, satellites have almost continuously observed the microwave radiation traveling upward from the Earth, the “brightness temperature” of the planet. Passive microwave sensors can see through most clouds and collect measurements day and night. This information enables researchers to monitor land surface conditions even in hazardous, remote locations and during the long polar night.
Passive sensors are those that receive only radiation coming up through the atmosphere, which is distinct from active sensors, like radar, that emit their own signals and receive a reflected echo of that signal. Scientists have mined Earth’s long, reliable passive microwave emissions record to derive significant and meaningful climate records of many parameters, including the dramatic decline in Arctic sea ice, even though passive microwave sensors provide measurements at relatively coarse spatial resolutions [Bhatt et al., 2014].
We are now completely reprocessing data from the historical passive microwave record to increase image spatial resolution.
We are now completely reprocessing data from the historical passive microwave record, taking advantage of recent sensor intercalibration efforts [Berg et al., 2013; Hilburn and Wentz, 2008] and using state-of-the-art numerical methods to increase image spatial resolution. The resulting 37-year Calibrated Passive Microwave Daily EASE-Grid 2.0 Brightness Temperature (CETB) Earth System Data Record (ESDR) will freely available to researchers in 2017.
The Satellite Missions
Engineers have built and launched several different radiometers on satellite platforms, and multiple instruments have been in orbit simultaneously since the early 1990s. The CETB product includes observations from four different types of radiometers on 11 satellite platforms:
- Scanning Multichannel Microwave Radiometer on Nimbus 7
- Special Sensor Microwave Imagers on the Defense Meteorological Satellite Program (DMSP) satellites F08, F10, F11, F13, F14, and F15
- Advanced Microwave Scanning Radiometer–Earth Observing System on the Aqua satellite
- Special Sensor Microwave Imager/Sounders on DMSP F16, F17, and F18
Each sensor can detect multiple frequencies in the 6- to 90-gigahertz range (centimeter-scale wavelengths); the improvement in spatial resolution varies by frequency and sensor.
Better Spatial Resolution
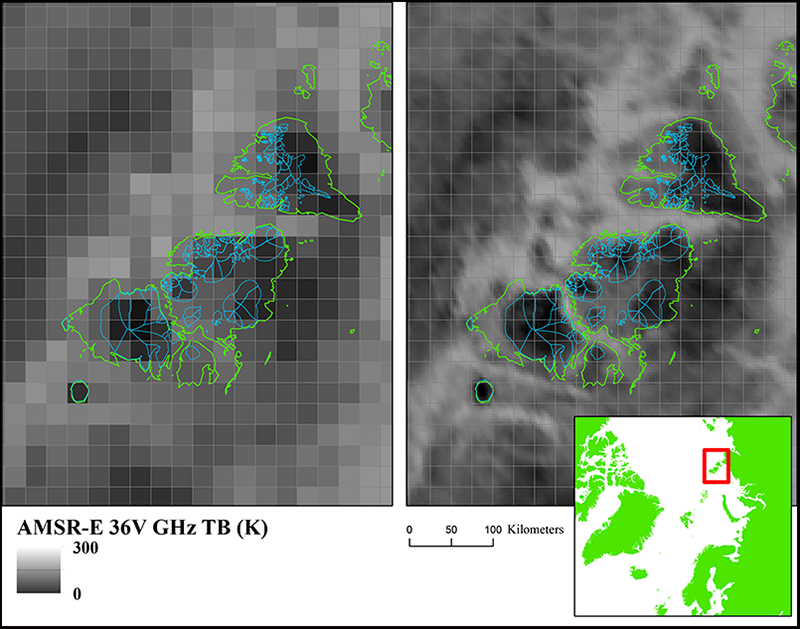
Satellite visible imagery can provide images at resolutions of a meter or better, but passive microwave sensors are limited to resolutions of tens of kilometers. For comparison, a photograph from a microwave sensor looking across the Grand Canyon, taken at 10-kilometer resolution, would contain only one pixel instead of the whole, detailed, magnificent scene. A satellite collecting these 10-kilometer pixels across a broad swath of Earth can supply scientists with enough information to track regional changes in physical environments and ecosystems. However, pixels that cover heterogeneous areas (e.g., where water meets land or where ice meets ocean) and the current limitations of data averaging techniques have limited the use of information in these areas (Figure 1).
Despite these limitations, microwave sensors are remarkably stable engineering instruments, and measurements from a single instrument remain consistent over time. However, measurement records from each satellite require careful cross calibration between that satellite and records from the next satellite in the mission sequence to separate real changes in the measured phenomena from artifacts caused by variations in satellite orbits over time.
As a part of the CETB project, our group of researchers from the Microwave Earth Remote Sensing Laboratory at Brigham Young University and the National Snow and Ice Data Center (NSIDC) at the Cooperative Institute for Research in Environmental Sciences of the University of Colorado Boulder has developed techniques to produce global brightness temperature (TB) maps. Even though the sensors have 10-kilometer resolution, these maps resolve features as small as 3 kilometers on a set of standard map projections known as EASE-Grid 2.0 [Brodzik et al., 2012].
The enhanced spatial resolution will allow scientists to analyze trends in coastal regions and marginal ice zones. Using EASE-Grid 2.0 projections removes formatting barriers that have previously plagued data users wanting to work in the popular GeoTIFF standard, simplifying the steps needed to overlay coastlines and compare with other data sources.
Spatial Resolution Enhancement
Researchers use computational resampling techniques to transform a continuous stream of swath measurements to fixed, daily Earth locations.
To produce the CETB Earth-gridded microwave temperatures, researchers must use computational resampling techniques to transform a continuous stream of swath measurements to fixed, daily Earth locations. Resampling techniques range from the computationally simple and fast to the sophisticated and expensive. Simple resampling techniques, including nearest-neighbor sampling, are fast, but they alter the geolocation information. Other simple averaging techniques smooth the data and obscure real temporal and spatial variability.
To circumvent these sources of imprecision, past approaches to processing historical gridded passive microwave data have used more complicated techniques that take into account engineering parameters, including the size and shape of the sensor antenna and scanning geometry. However, these techniques were extremely computationally expensive and required large allocations of supercomputing resources.
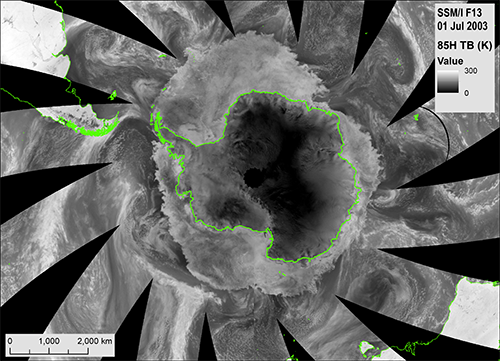
The CETB resampling algorithm, called Radiometer Scatterometer Image Reconstruction (rSIR), uses an innovative numerical technique to produce high-quality, enhanced-resolution imagery at a fraction of the computational cost of previously available techniques [Long and Brodzik, 2016]. Comparing simple averaged images to enhanced-resolution versions of the same data (Figure 1) illustrates greater feature details, especially along transition zones at ice edges and land-water boundaries. The enhanced-resolution CETB data reveal details of ice sheets and sea ice and atmospheric and ocean features (Figure 2) for the complete available sensor record and at higher spatial resolutions than have previously been discernible from these instruments.
Applications
The real benefits of the enhanced-resolution CETB product will be demonstrated when the complete CETB data set is available. Consistently mapped TB measurements for the complete satellite record will facilitate the use of satellite radiometer observations to enable researchers to better distinguish real climate signals from intersensor artifacts. This data product will support studies of geophysical parameters such as the following:
- snow extent and water equivalent [Takala et al., 2011]
- ice field and ice sheet melt onset and freeze timing [Ramage and Isacks, 2002; Tedesco, 2007]
- soil moisture analysis [Seuffert et al., 2004]
- [pullquote float=”right”]The enhanced-resolution product will enable studies over a longer research period than has previously been possible.[/pullquote]vegetation index [Kustas et al., 1993]
- land surface temperature [McFarland et al., 1990]
- oceanic whitecap detection [Anguelova and Webster, 2006]
- observing terrestrial features in general [Farrar and Smith, 1992]
The enhanced-resolution CETB product will also enable studies over a longer research period than has previously been possible, with data that have been vetted, quality controlled, and consistently gridded at the highest possible resolution.
Early Adopters
A volunteer community, whom we call early adopters, has recently finished an initial evaluation of prototype CETB data, and the complete CETB product will be available by mid-2017. The NASA NSIDC Distributed Active Archive Center will provide data management and distribution services.
As part of the NASA Making Earth System Data Records for Use in Research Environments (MEaSUREs) initiative and to encourage informed analysis of the data set, we have provided extensive documentation regarding the development and characteristics of the CETB. Additional details on the optimum image formation are also available [Long and Brodzik, 2016]. The data producers encourage exploration and research using this new product and invite suggestions and comments.
Acknowledgments
This research is supported by NASA MEaSUREs grant NNX13AI23A at NSIDC and NASA MEaSUREs grant NNX13AI26A at Brigham Young University. The CETB product is produced on the Janus supercomputer, which is supported by the National Science Foundation (award CNS-0821794) and the University of Colorado Boulder. The Janus supercomputer is a joint effort of the University of Colorado Boulder, the University of Colorado Denver, and the National Center for Atmospheric Research.
References
Anguelova, M. D., and F. Webster (2006), Whitecap coverage from satellite measurements: A first step toward modeling the variability of oceanic whitecaps, J. Geophys. Res., 111, C03017, doi:10.1029/2005JC003158.
Berg, W., et al. (2013), Improved geolocation and Earth incidence angle information for a fundamental climate data record of the SSM/I sensors, IEEE Trans. Geosci. Remote Sens., 51(3), 1504–1513, doi:10.1109/TGRS.2012.2199761.
Bhatt, U. S., et al. (2014), Implications of Arctic sea ice decline from the Earth system, Annu. Rev. Environ. Resour., 39, 57–89, doi:10.1146/annurev-environ-122012-094357.
Brodzik, M. J., et al. (2012), EASE-Grid 2.0: Incremental but significant improvements for Earth-gridded data sets, ISPRS Int. J. Geo Inf., 1(1), 32–45, doi:10.3390/ijgi1010032. [Correction, ISPRS Int. J. Geo Inf., 3(3), 1154–1156, doi:10.3390/ijgi3031154.]
Farrar, M. R., and E. A. Smith (1992), Spatial resolution enhancement of terrestrial features using deconvolved SSM/I microwave brightness temperatures, IEEE Trans. Geosci. Remote Sens., 30(2), 349–355, doi:10.1109/36.134084.
Hilburn, K. A., and F. J. Wentz (2008), Intercalibrated passive microwave rain products from the Unified Microwave Ocean Retrieval Algorithm (UMORA), J. Appl. Meteorol. Climatol., 47, 778–794, doi:10.1175/2007JAMC1635.1.
Kustas, W. P., et al. (1993), Relationships between evaporative fraction and remotely sensed vegetation index and microwave brightness temperature for semiarid rangelands, J. Appl. Meteorol., 32, 1781–1790, doi:10.1175/1520-0450(1993)032<1781:RBEFAR>2.0.CO;2.
Long, D. G., and M. J. Brodzik (2016), Optimum image formation for spaceborne microwave radiometer products, IEEE Trans. Geosci. Remote Sens., 54(5), 2763–2779, doi:10.1109/TGRS.2015.2505677.
McFarland, M. J., R. L. Miller, and C. M. U. Neale (1990), Land surface temperature derived from the SSM/I passive microwave brightness temperatures, IEEE Trans. Geosci. Remote Sens., 28(5), 839–845, doi:10.1109/36.58971.
Ramage, J. M., and B. L. Isacks (2002), Determination of melt-onset and refreeze timing on southeast Alaskan icefields using SSM/I diurnal amplitude variations, Ann. Glaciol., 34(1), 391–398, doi:10.3189/172756402781817761.
Ramage, J., M. J. Brodzik, and M. A. Hardman (2016), Melt on the margins: Calibrated, enhanced-resolution brightness temperatures to map melt onset near glacier margins and transition zones, poster presented at the 73rd Annual Meeting of the Eastern Snow Conference, Columbus, Ohio, 14–16 June.
Raup, B. H., et al. (2007), The GLIMS geospatial glacier database: A new tool for studying glacier change, Global Planet. Change, 56, 101–110, doi:10.1016/j.gloplacha.2006.07.018.
Seuffert, G., et al. (2004), The usage of screen-level parameters and microwave brightness temperature for soil moisture analysis, J. Hydrometeorol., 5(3), 516–531, doi:10.1175/1525-7541(2004)005<0516:TUOSPA>2.0.CO;2.
Takala, M., et al. (2011), Estimating Northern Hemisphere snow water equivalent for climate research through assimilation of spaceborne radiometer data and ground-based measurements, Remote Sens. Environ., 115(12), 3517–3529, doi:10.1016/j.rse.2011.08.014.
Tedesco, M. (2007), Snowmelt detection over the Greenland ice sheet from SSM/I brightness temperature daily variations, Geophys. Res. Lett., 34(2), L02504, doi:10.1029/2006GL028466.
Wessel, P., and W. H. F. Smith (2015), A global, self-consistent, hierarchical, high-resolution geography database, version 2.3.4., https://www.soest.hawaii.edu/pwessel/gshhg.
Author Information
A. C. Paget, Department of Marine Sciences, University of Connecticut, Groton; M. J. Brodzik (email: [email protected]), National Snow and Ice Data Center, Cooperative Institute for Research in Environmental Science (CIRES), University of Colorado Boulder; D. G. Long, Microwave Earth Remote Sensing Laboratory, Brigham Young University, Provo, Utah; and M. A. Hardman, National Snow and Ice Data Center, CIRES, University of Colorado Boulder
Citation:
Paget, A. C.,Brodzik, M. J.,Long, D. G., and Hardman, M. A. (2016), Bringing Earth’s microwave maps into sharper focus, Eos, 97, https://doi.org/10.1029/2016EO063675. Published on 21 December 2016.
Text © 2016. The authors. CC BY-NC-ND 3.0
Except where otherwise noted, images are subject to copyright. Any reuse without express permission from the copyright owner is prohibited.