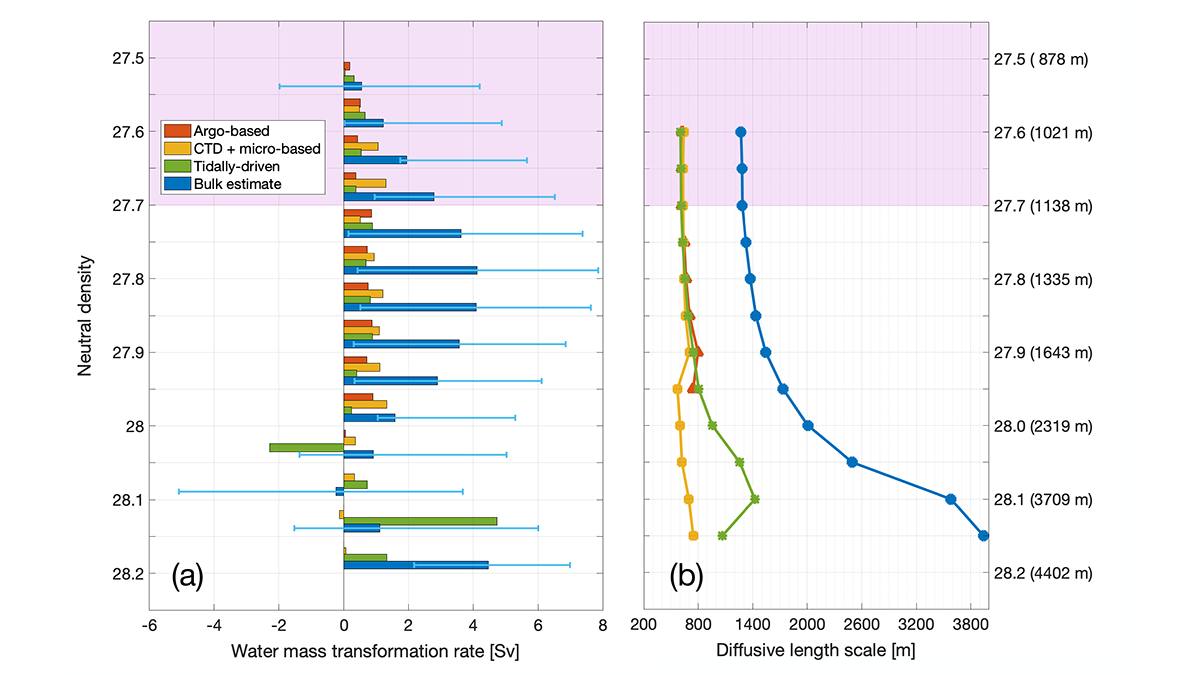
Quantitative observation-based estimates highlight the contribution of diapycnal mixing to the Atlantic Meridional Overturning Circulation, water mass formation, and tracer transfers and pathways.
Editors’ Highlights
Posted inEditors' Highlights
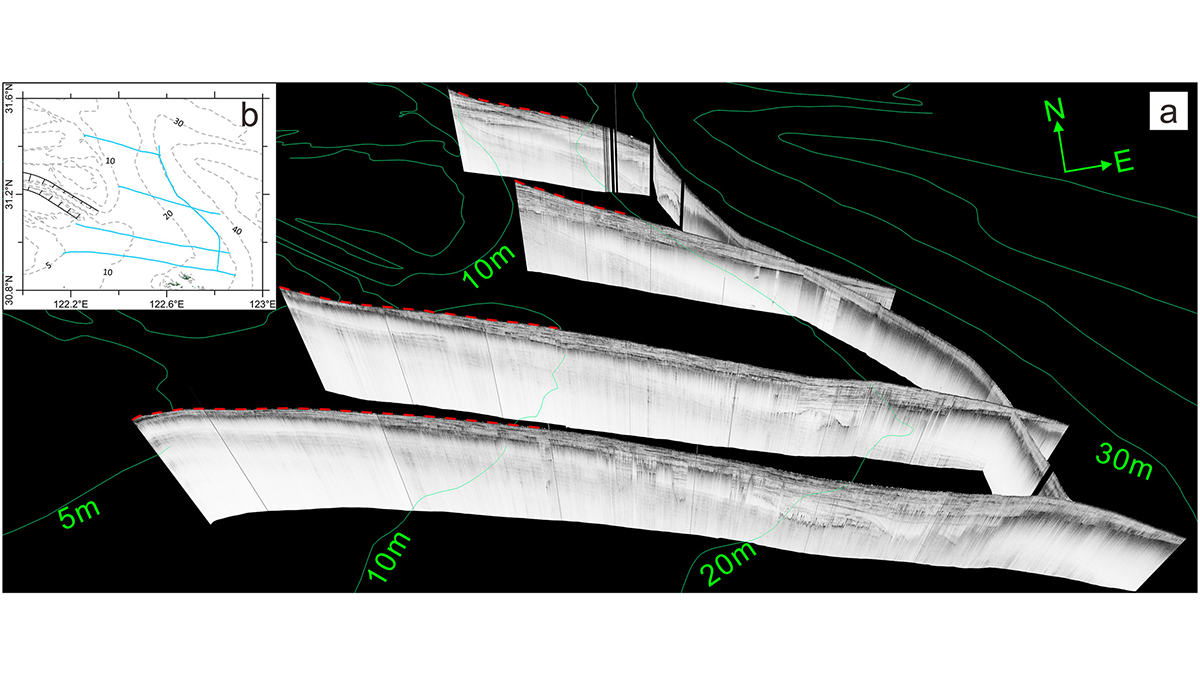
Delta Degradation Leads to Exacerbated Greenhouse Gas Emissions
Seismic ship surveys and seabed elevation maps of the Yangtze subaqueous delta reveal how the reduction of sediment supply to the coastal ocean can trigger increased greenhouse gas emissions.
Posted inEditors' Highlights
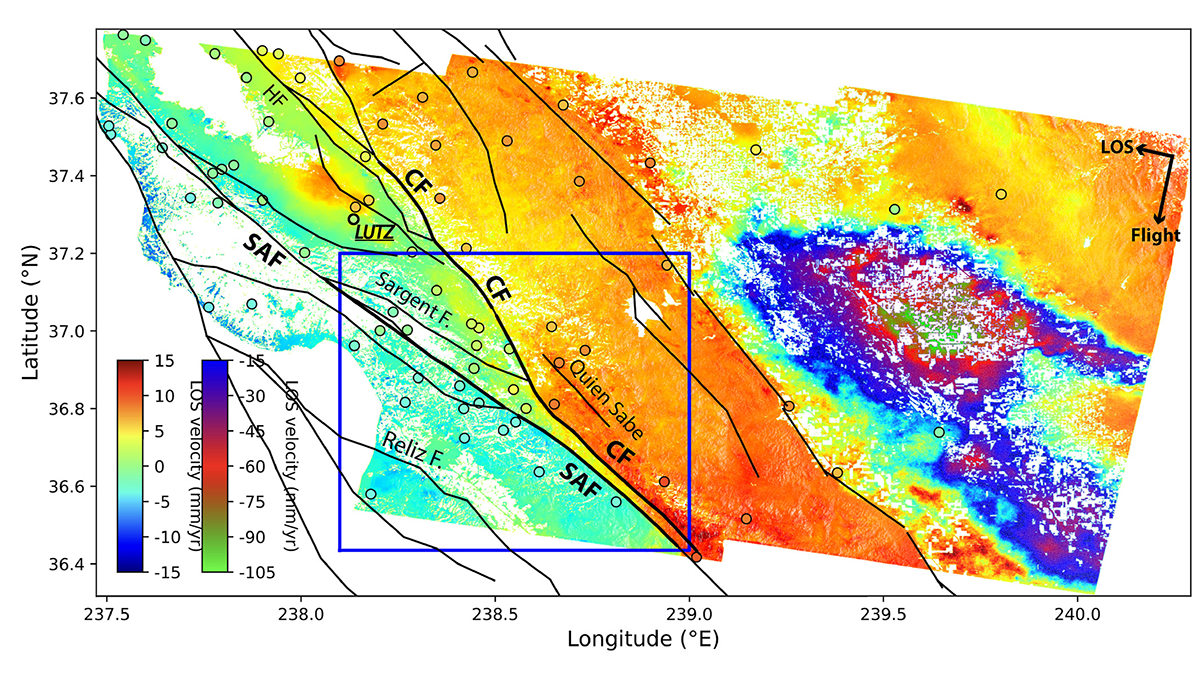
Radar Satellites Capture Subtle Slip Evolution on Faults
A five-year time series from radar satellite imagery tracks surface slip on major faults in the San Francisco Bay Area, capturing subtle velocity variations and controlling factors.
Posted inEditors' Highlights
Updated Reference Standard for Total Solar Irradiance
Version 2 of the Total and Spectral Solar Irradiance Sensor-1 Hybrid Solar Reference Spectrum captures a spectral resolution spanning 0.115-200 micrometers and integrates nearly 100% of the TSI energy.
Posted inEditors' Highlights
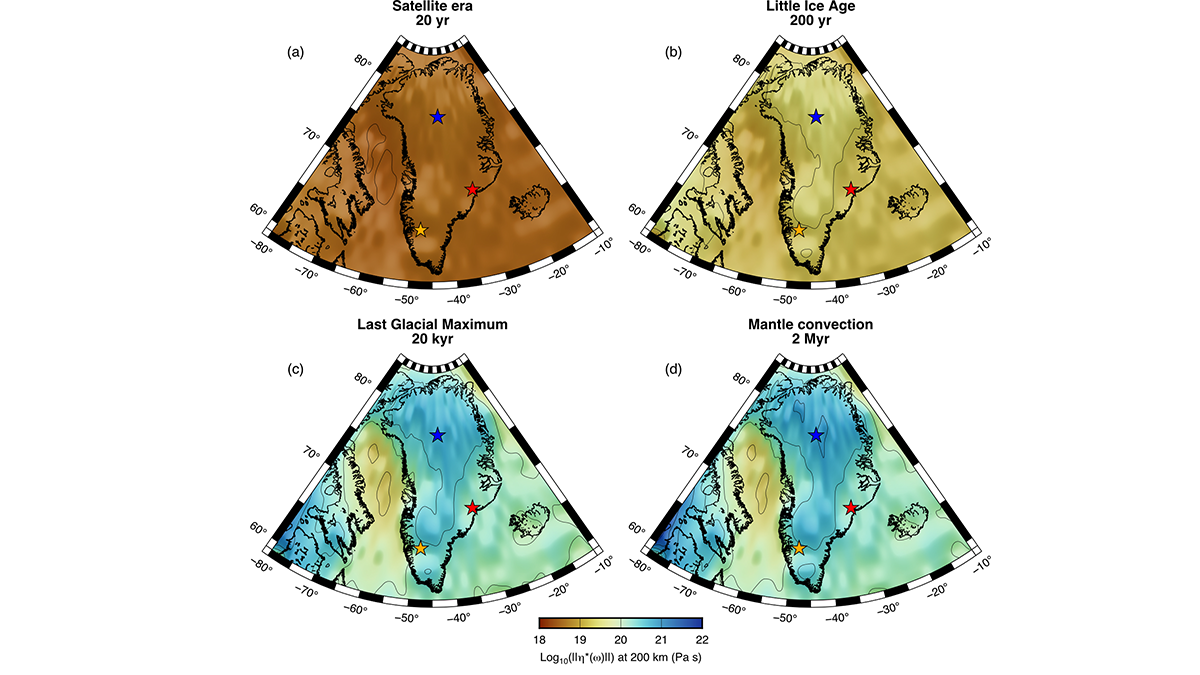
4D Viscosity Constraints from Greenland
The mantle’s resistance to flow appears different for glacial and plate tectonic timescales but this behavior can be reconciled with new thermo-mechanical models of the asthenosphere.
Posted inEditors' Highlights
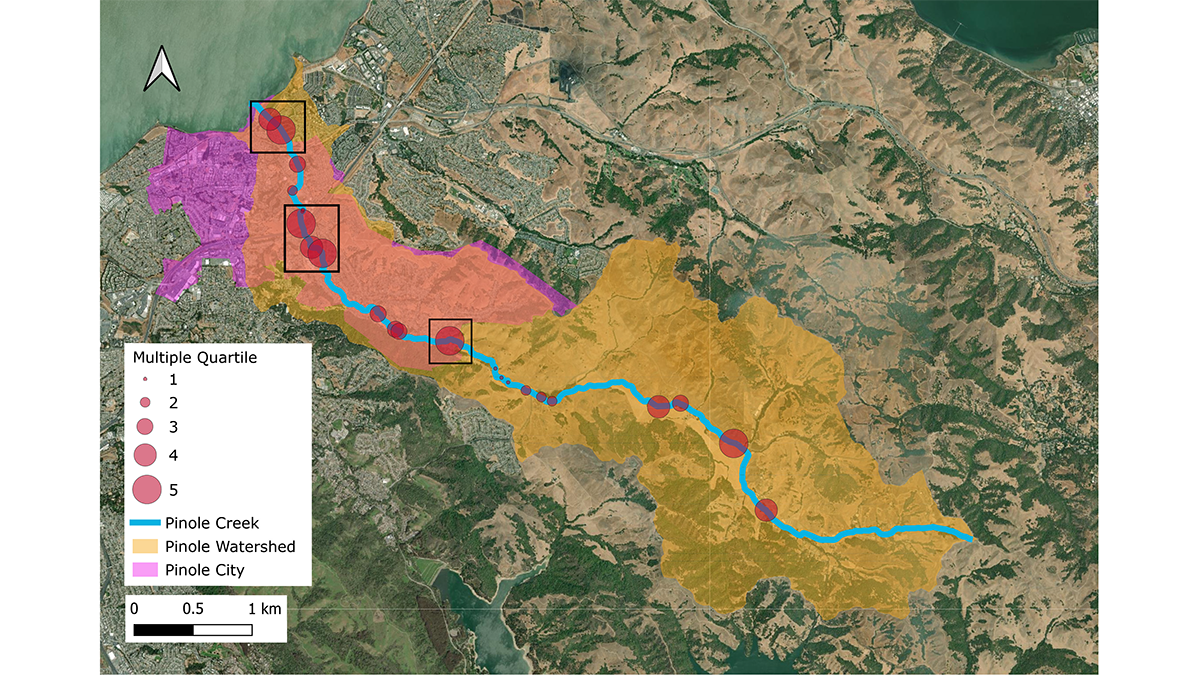
Taking Trash into Their Own Hands—Community Science to Policy
Community effort to systematically count and categorize trash in the Pinole watershed led to the prioritization of locations and trash types that informed recommendations for local government policy.

Posted inEditors' Highlights
Scotland’s Last Glaciers Cause a Shift in an Old Paradigm
Cosmogenic geochronology of Scotland’s vanished glaciers indicates that the paradigm of weakened North Atlantic currents causing a rapid regional cooling is no longer valid.
Posted inEditors' Highlights
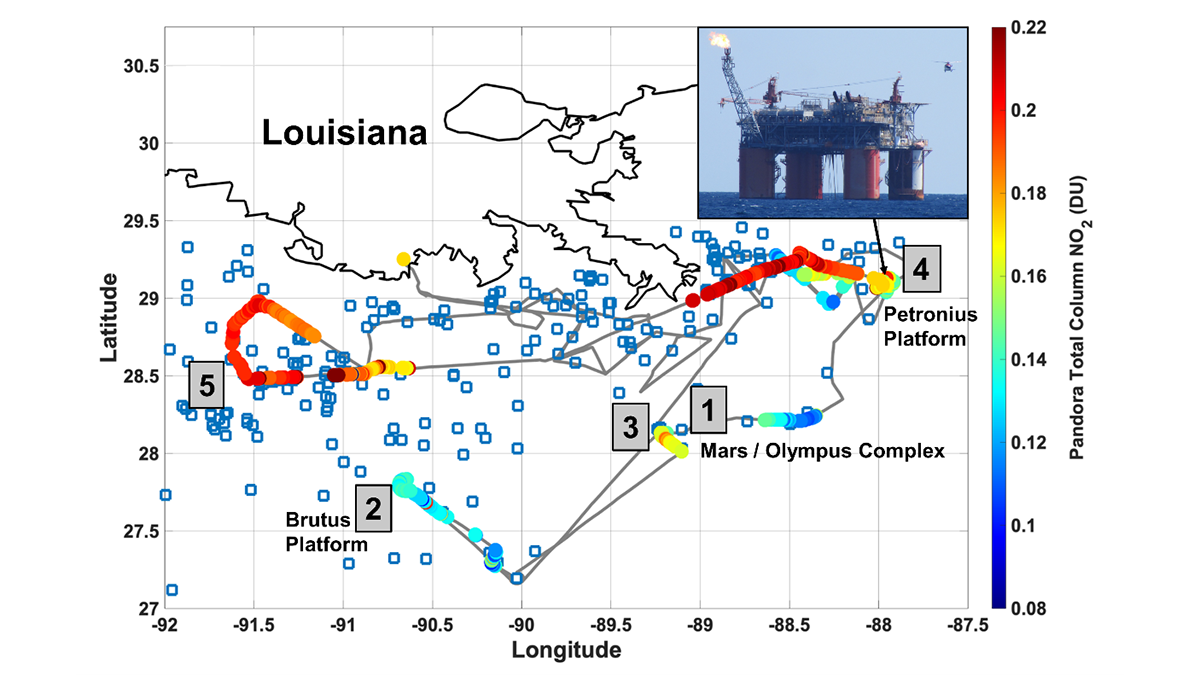
Remote Sensors See NO2 ‘Hot Spots’ from Offshore Oil Activity
Satellites can see NO2 pollution from space, but can they detect individual oil and natural gas operations, and are the measurements accurate?

Posted inEditors' Highlights
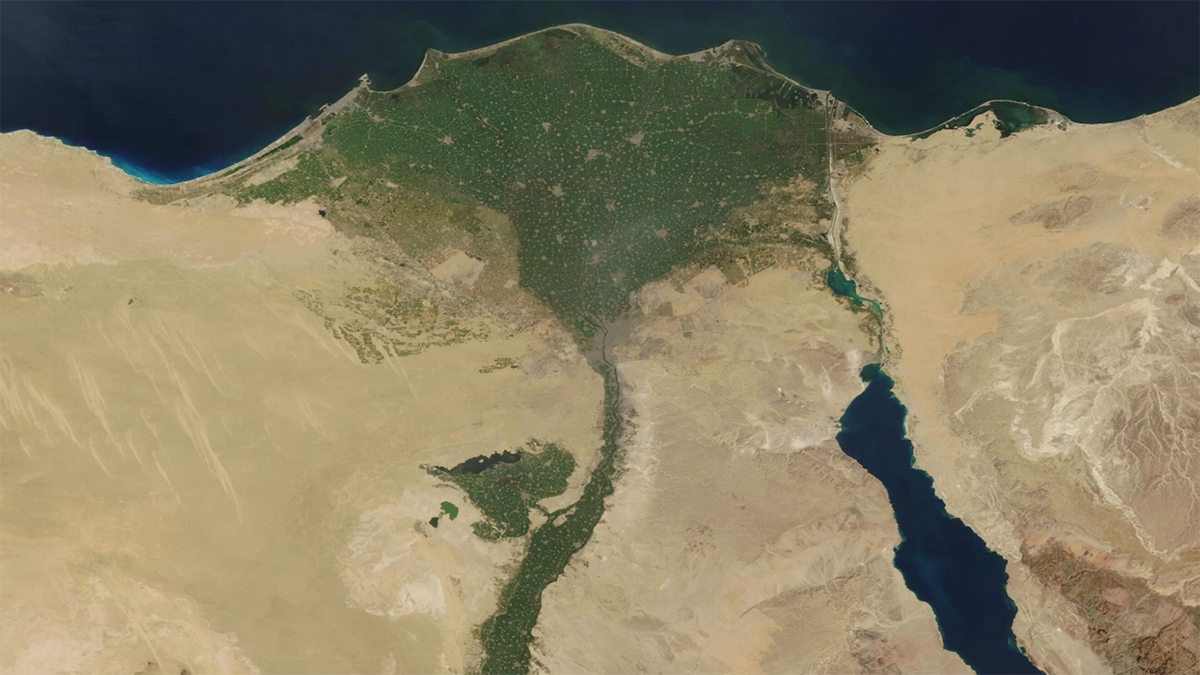
Tracking Heavy Metal Accumulation in the Nile Delta
Sediment measurements show that flow alterations and discharges are driving increasing concentrations of multiple heavy metals in the Nile Delta, threatening ecosystems, agriculture, and human health.
Posted inEditors' Highlights
Suivie de l’accumulation des métaux lourds dans le Delta du Nil
Les analyses de sédiments montrent que la réutilisation de l’eau non traitée et la construction de barrages entraînent l’augmentation des concentrations de métaux lourds dans le Delta du Nil, menaçant gravement les écosystèmes, l’agriculture et la santé humaine.