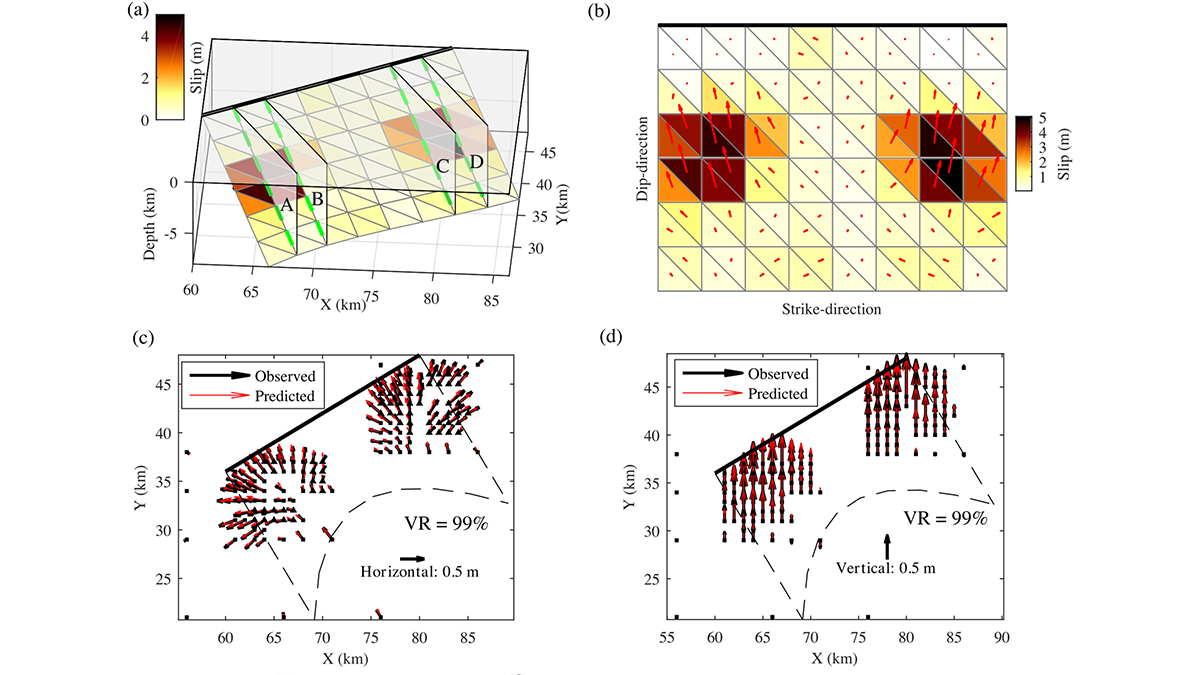
A new Bayesian inversion framework is used to solve non-planar geometry of a ruptured fault from spatially variable slip and rake measured with geodesy.
Editors’ Highlights
Posted inEditors' Highlights
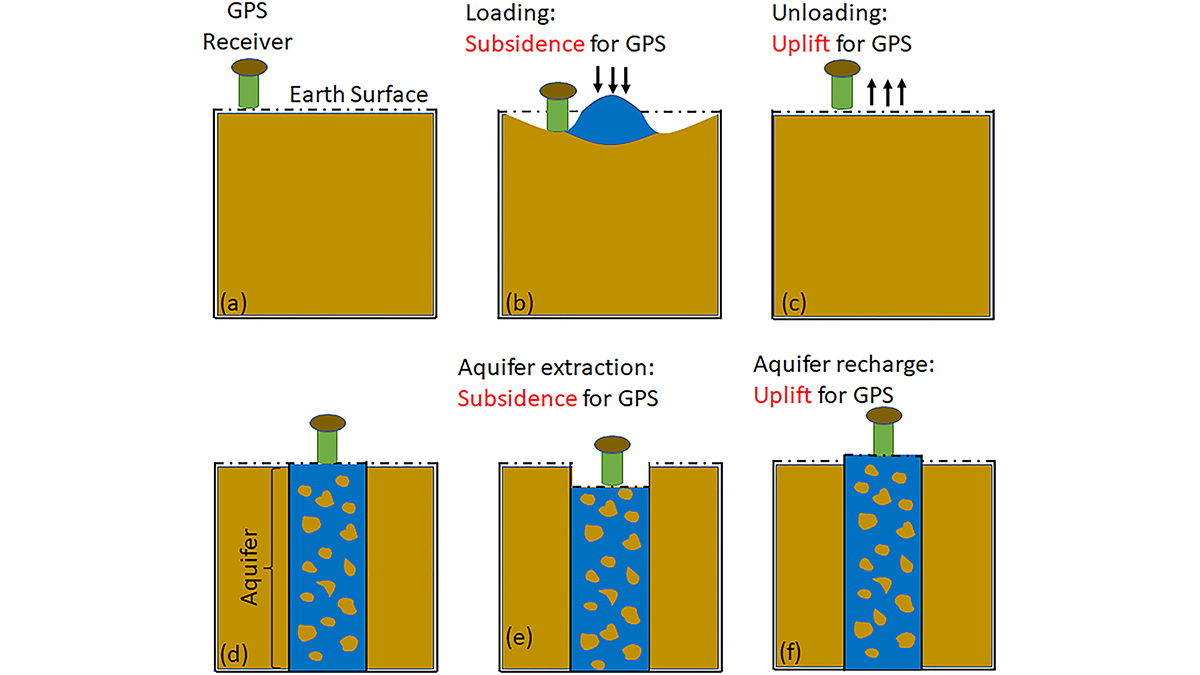
GPS Observations Sense Groundwater Change in Australia
By exploiting the fact that changes in groundwater cause deformations of the Earth’s surface, GPS receivers are used to detect groundwater changes related to extreme events and to seasonal oscillations.

Posted inEditors' Highlights
Collaboration Helps Overcome Challenges in Air Quality Monitoring
Everything looks ideal for collaboration: interest from community members, a new method for monitoring air quality by scientists, and interest from policymakers. What happens next?
Posted inEditors' Highlights
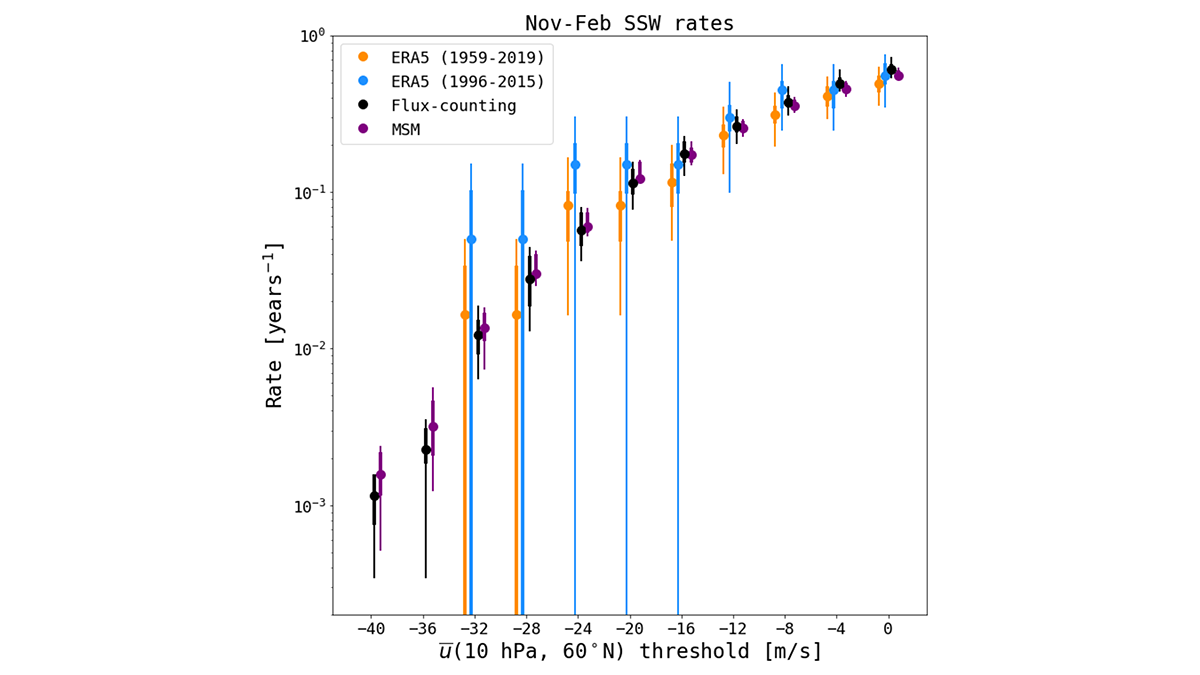
Quantifying Extreme Events from Short Weather Forecast Data
Subseasonal weather forecast ensembles are a useful tool for overcoming the inherent difficulty of quantifying extreme weather risk caused by data scarcity.
Posted inEditors' Highlights
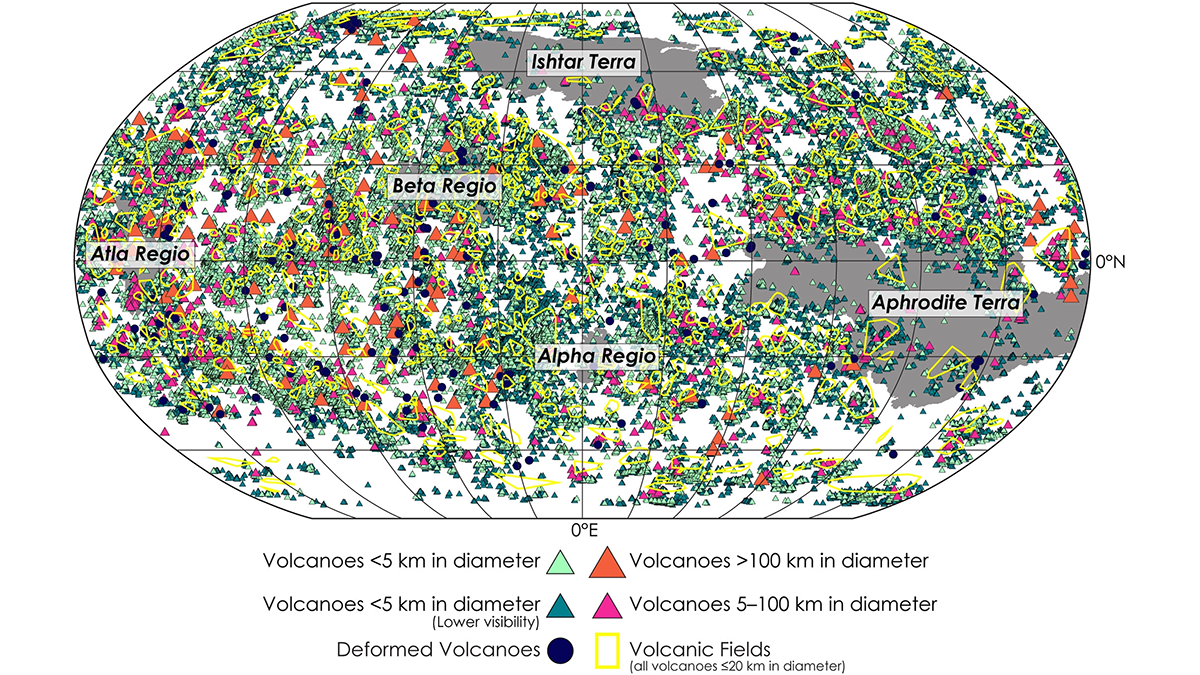
A New View of Volcanism on Venus
Researchers present the most comprehensive catalog of Venusian volcanic edifices to date, providing new knowledge of the geological evolution of a relatively understudied planet.

Posted inEditors' Highlights
Analyzing Sources of Pollution in the Great Lakes
Understanding how agriculture and land use affect nutrient flows and concentrations in the vast area of the Great Lakes is an essential step to developing sustainable management strategies.

Posted inEditors' Highlights
Meshless Methods Tell Us What Lurks Beneath the Surface
Limitations with resolving complex underground targets with sufficiently fine resolution may be alleviated through the adoption of meshless electromagnetic methods.
Posted inEditors' Highlights
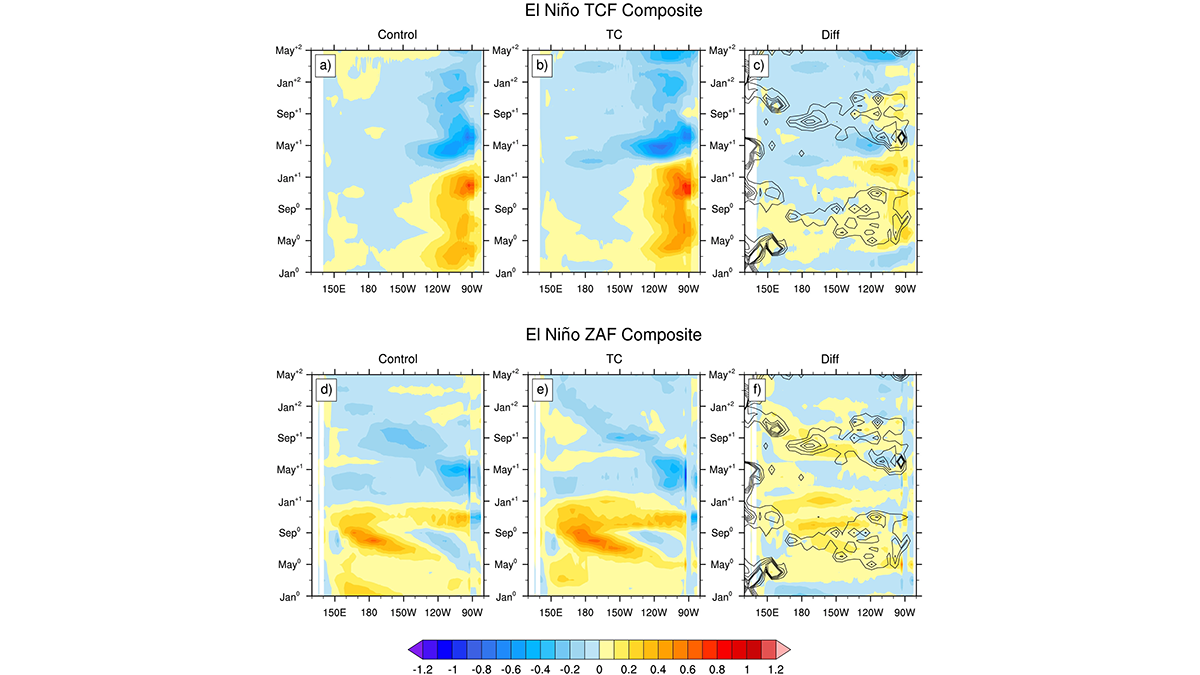
Impact of Tropical Cyclones on El Niño-Southern Oscillation
A suite of Earth Systems model experiments is used to explore how tropical cyclones influence the frequency, magnitude, and timing of El Niño-Southern Oscillation events.
Posted inEditors' Highlights
Taking Cloud Microphysics Experiments to the Next Level
Experiments in a cloud chamber have provided valuable insights into microphysical processes and will get more realistic as the height of the chamber increases.

Posted inEditors' Highlights
The Depleted Mantle Merry-Go-Round
Abyssal peridotites show through their isotopic composition a complex history. From differences we can infer the existence of ultra depleted mantle and an uneven contribution to ridge magmatism.