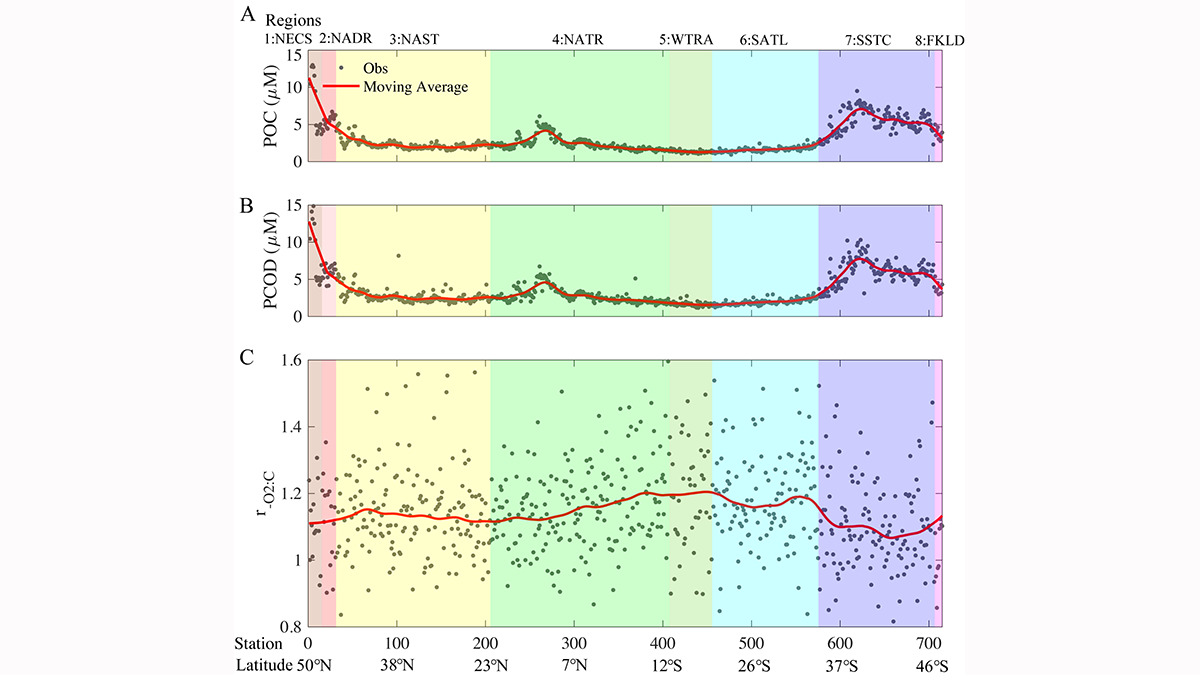
Respiration quotients in the Atlantic and Pacific Oceans reflect different water temperature, nutrient stress and phytoplankton community structure, important for regional carbon and oxygen cycling.
Editors’ Highlights
Posted inEditors' Highlights
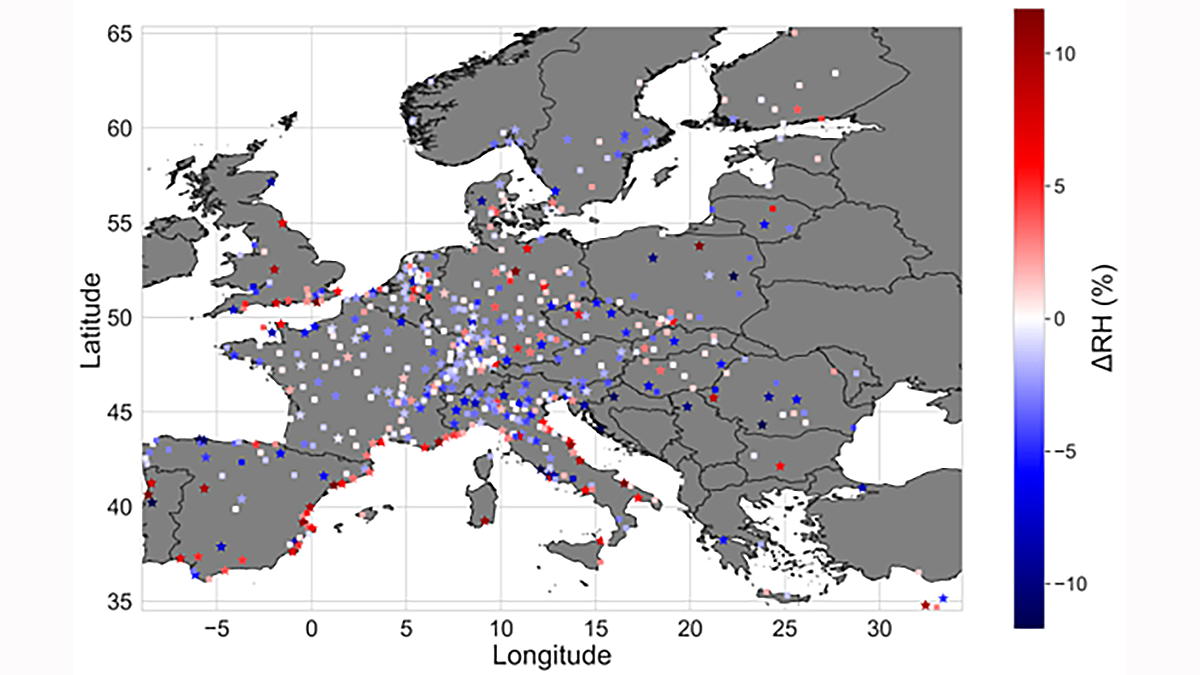
The Lower Humidity of Urban Areas Moderates Outdoor Heat Stress
Data scarcity of traditional observations cannot reveal whether surface temperature capture the potential for urban heat stress. This study improves the dataset with 40,000 citizen weather stations.
Posted inEditors' Highlights
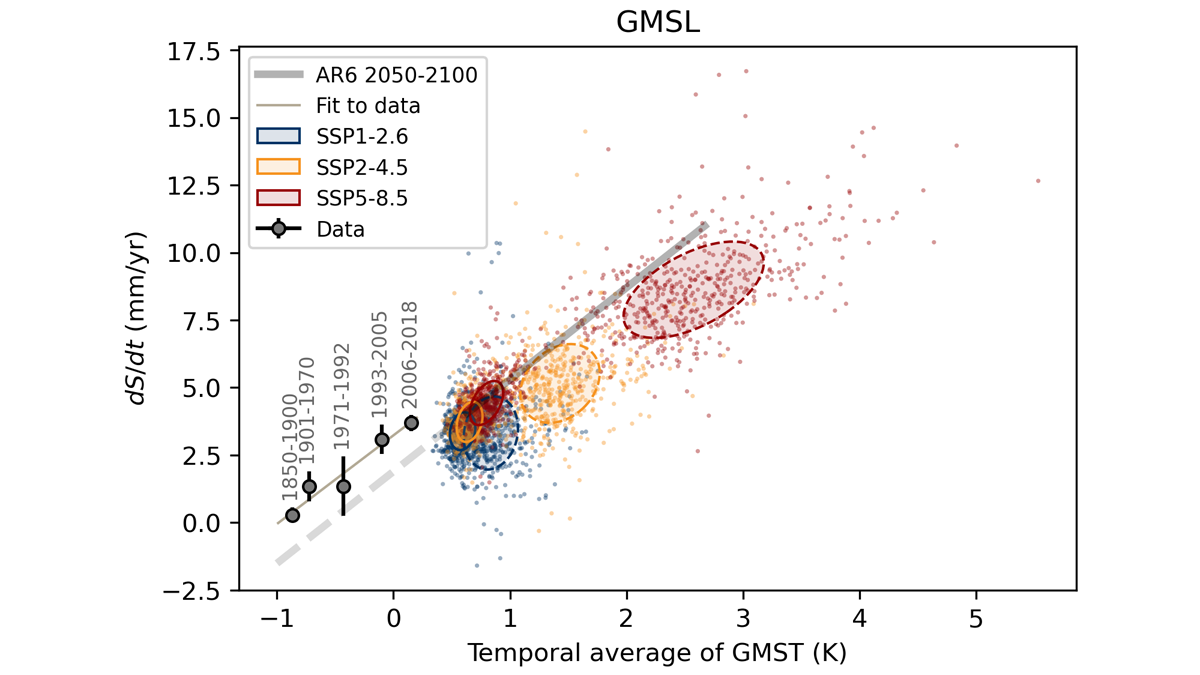
Surface Temperature Sets the Pace of Sea Level Rise
Reining in global mean sea level rise from land-ice wastage and ocean thermal expansion requires reducing global mean surface temperatures to near-preindustrial values.

Posted inEditors' Highlights
Tracing Oxidizing Slab Fluids in Cold Volcanic Arcs
Elevated copper isotope ratios in arc magmas from fluid-rich cold subduction zones support the role of oxidizing fluids from the subducted lithospheric serpentinite in the oxidization of arc magmas.
Posted inEditors' Highlights
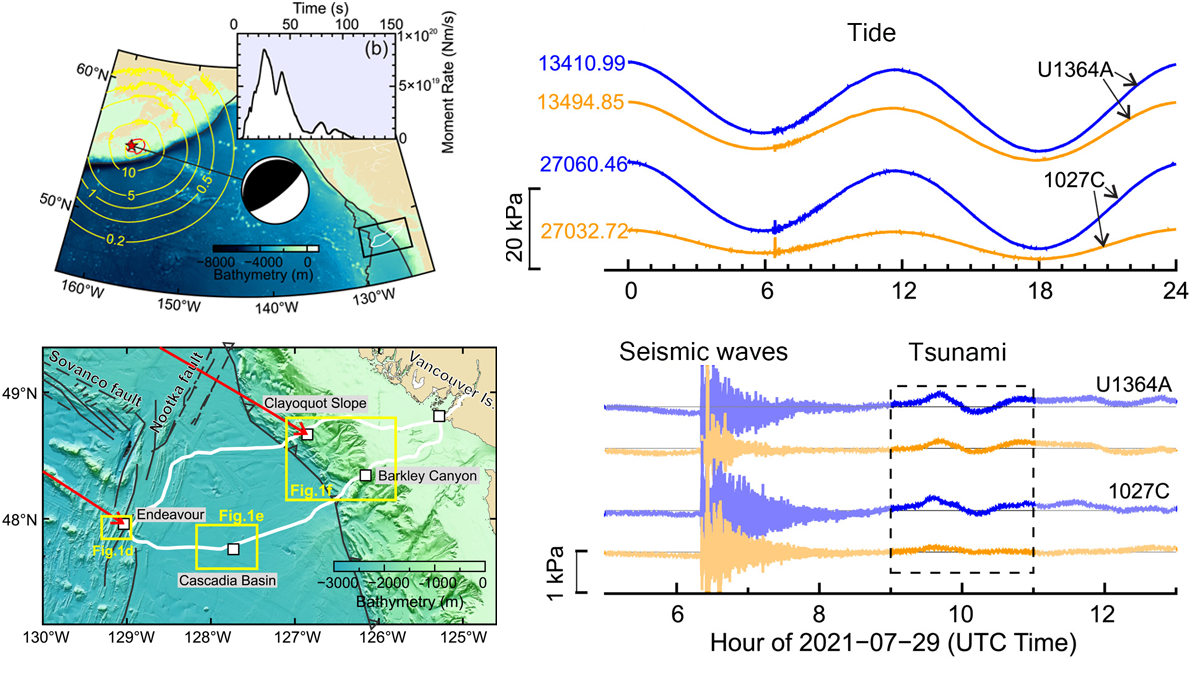
Under Pressure: Recording Earthquakes at and Below the Seafloor
Cabled ocean-floor observatories record ground shaking and pressure variations, which contribute to early warning systems and give us a unique view of the ocean–crust coupling.

Posted inEditors' Highlights
Can Anelastic Attenuation of Oceanic Mantle be Reliably Measured?
A new study demonstrates that robust anelastic attenuation measurements can be made across ocean bottom seismic arrays at different locations using surface wave array analysis.
Posted inEditors' Highlights
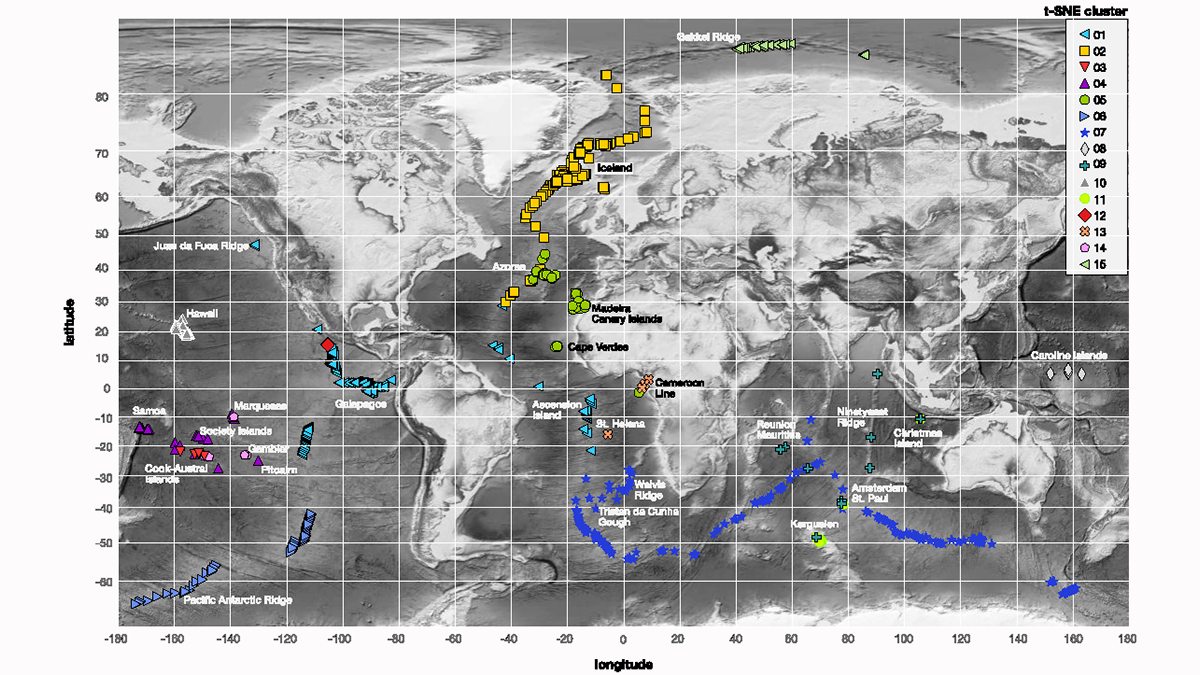
Machine Learning Looks Anew at Isotope Ratios in Oceanic Basalts
While past attempts to define isotopic endmembers and assign them a geodynamic significance ended in controversy, a machine-learning clustering algorithm offers a solution to this classical problem.

Posted inEditors' Highlights
Deep Learning for Hydrologic Projections Under Climate Change
Extrapolation or not? Big data may help deep learning to go places where it has not been before by transferring learned hydrologic relationships.

Posted inEditors' Highlights
What is the Best Predictor of Landfalling Hurricane Damage?
A new study finds that the minimum sea level pressure, as another measure of hurricane strength, is a better predictor of hurricane damage in the United States than the maximum sustained wind speed.
Posted inEditors' Highlights
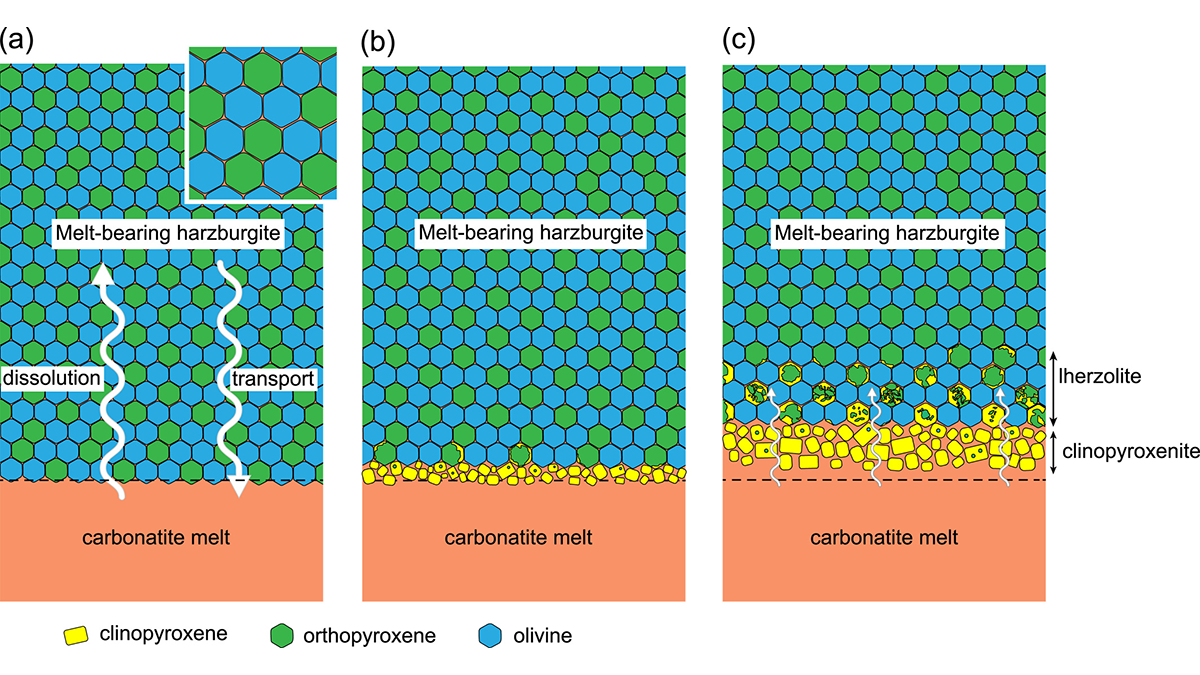
Why is the North China Craton Vulnerable to Destruction?
A new study suggests that carbonatite metasomatism, not silicate metasomatism as previously thought, was dominant prior to the removal of the North China Craton in the early Cretaceous.