
Mars 2020 Perseverance Rover images of abraded surface rocks may retain records of ancient wind directions, providing important ground-truth to our understanding of Mars’ recent climate history.
Editors’ Highlights

Posted inEditors' Highlights
Better Resolution Might Unlock the Mystery of Storms
Climate models have many persistent and systematic biases, but a new study shows that allowing for a physical rather than statistical representation of energy transport reduces one of them.

Posted inEditors' Highlights
Martian Lava, Up Close and Personal
The Mars 2020 Perseverance Rover conducted the first investigation of volcanic rocks where they stand in their original configuration on the surface of Mars.

Posted inEditors' Highlights
A New Approach to Spinning-Up Passive Tracers in Ocean Models
A new computational method enables finding steady-state distributions of tracers in ocean circulation models, opening opportunities for physical and biogeochemical insight.
Posted inEditors' Highlights
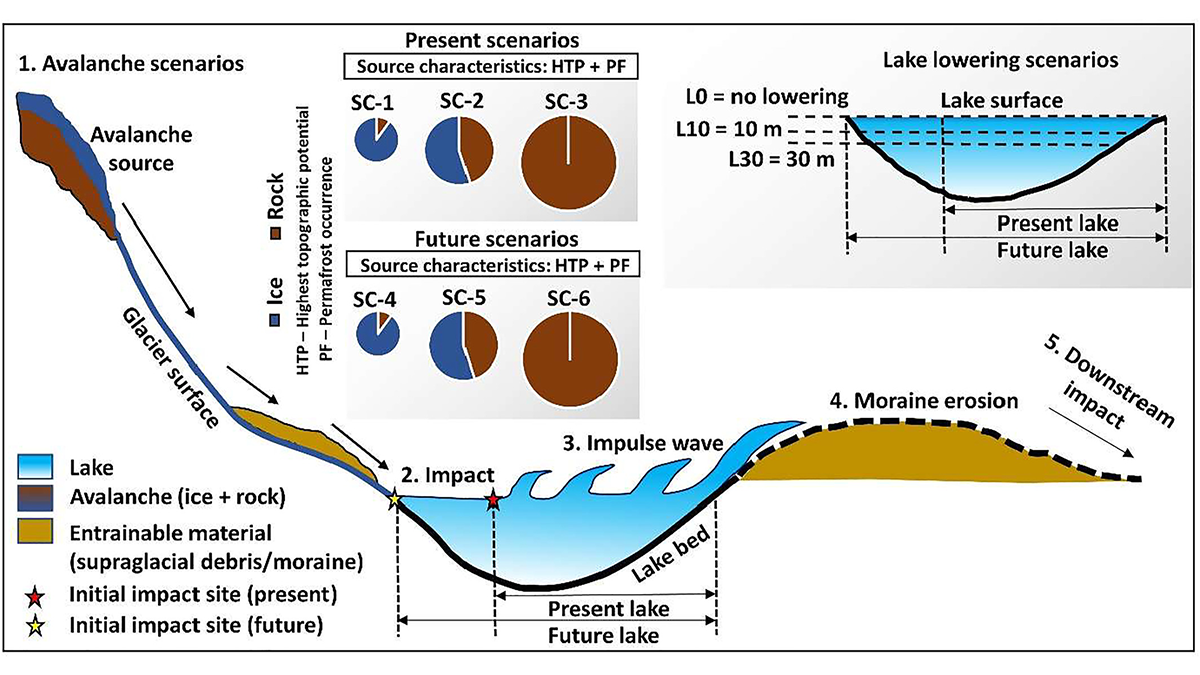
Artificial Lake-Level Lowering Alleviates Floods in the Himalayas
A new model combining future permafrost degradation and related avalanches demonstrates that artificial lake-lowering could significantly reduce the risk of glacial lake outburst floods.
Posted inEditors' Highlights
Examining Aerosol-Cloud-Climate Interactions at a Large Scale
A new numerical setup demonstrates that aerosols could affect clouds, and hence the radiation budget, thousands of kilometers from their location.

Posted inEditors' Highlights
Confronting Water Use and Heat Exposure in Urban Sustainability
A framework is proposed for urban forest management to mitigate heat exposure, lessen drought issues, and conserve water use for urban heat mitigation and resilience in environmentally stressed cities.

Posted inEditors' Highlights
Landfall Temperature of Atmospheric Rivers on the US West Coast
Atmospheric rivers that start in warm areas of the North Pacific generally stay warm, leading to warmer landfall temperatures in the western United States.
Posted inEditors' Highlights
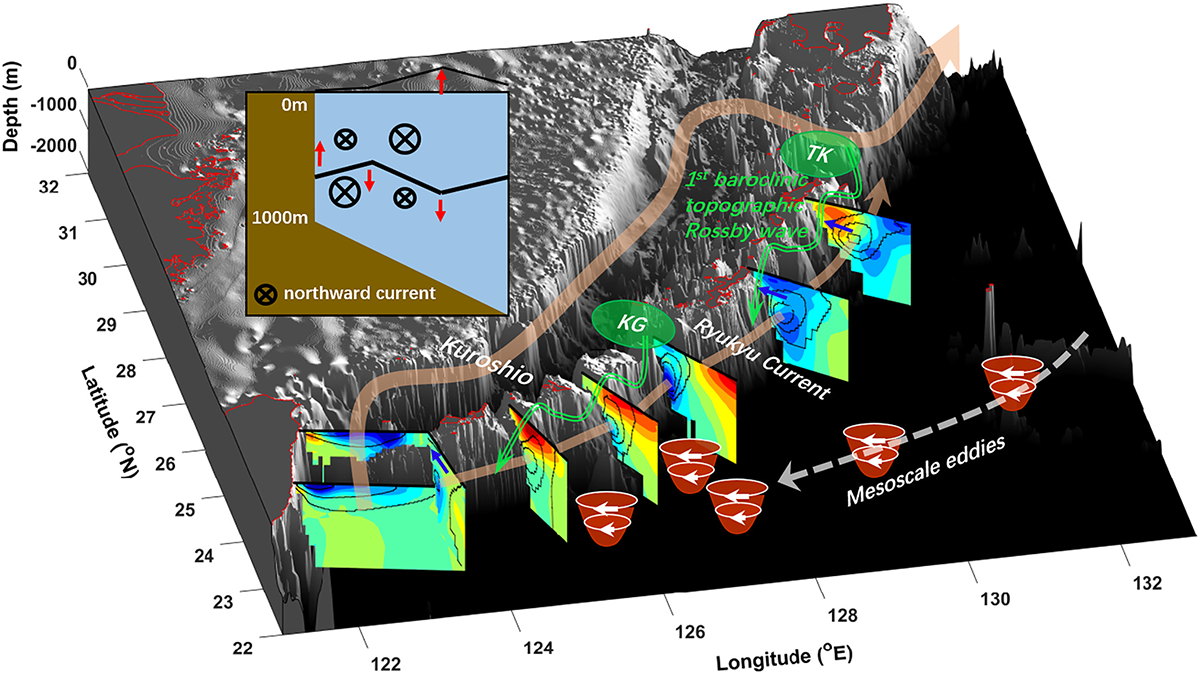
Weakened Kuroshio Slows Down the Ryukyu Current
A combination of the weakened Kuroshio in the Tokara Strait and an increase in anticyclonic eddies led to the slowdown of the Ryukyu Current from 1993 to 2018.
Posted inEditors' Highlights
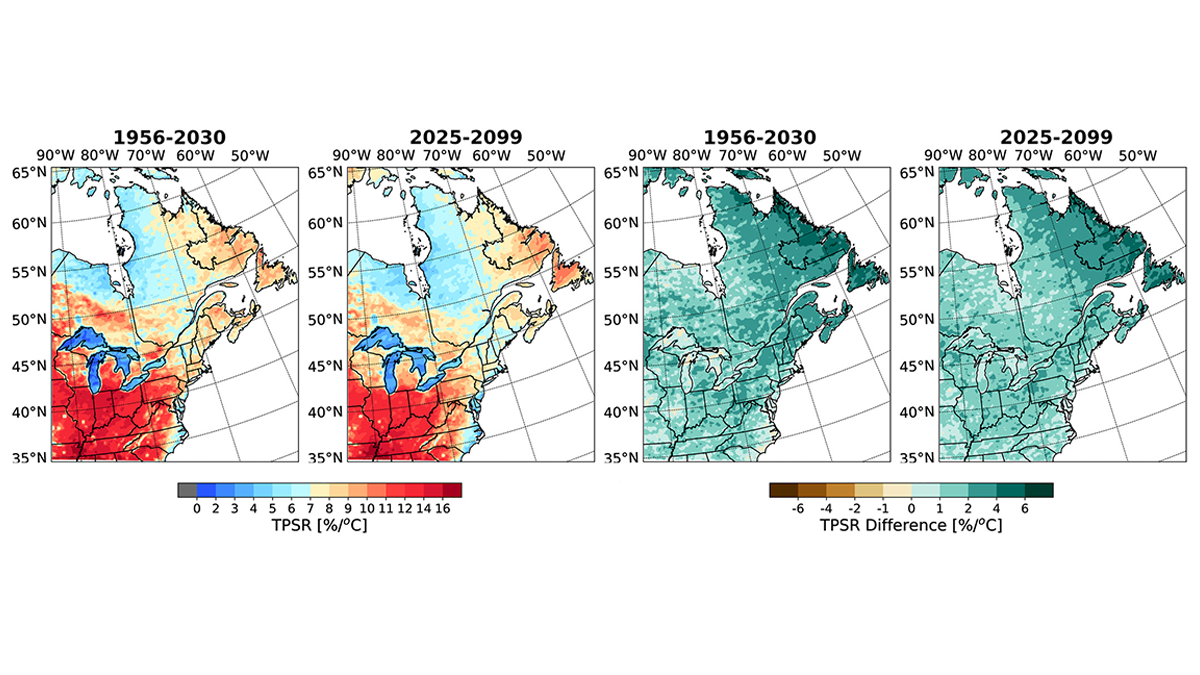
Rate of Temperature–Precipitation Scaling in Rainfall Events
Future extreme rain will be embedded in shorter, more convective dominant rainfall events in the northeastern region of North America, leading to larger rate in future temperature-precipitation scaling.