
Two-dimensional hydraulic simulations are a powerful tool to identify process domains such as channels, hillslopes, and floodplains in high-resolution topographic data.
Editors’ Highlights

Posted inEditors' Highlights
An Impact Basin Thermometer for the Moon
Large impact basins on the near side of the Moon lack the annulus of thickened crust that far-side basins have. The difference can be linked to the thermal structure of the lunar crust.
Posted inEditors' Highlights
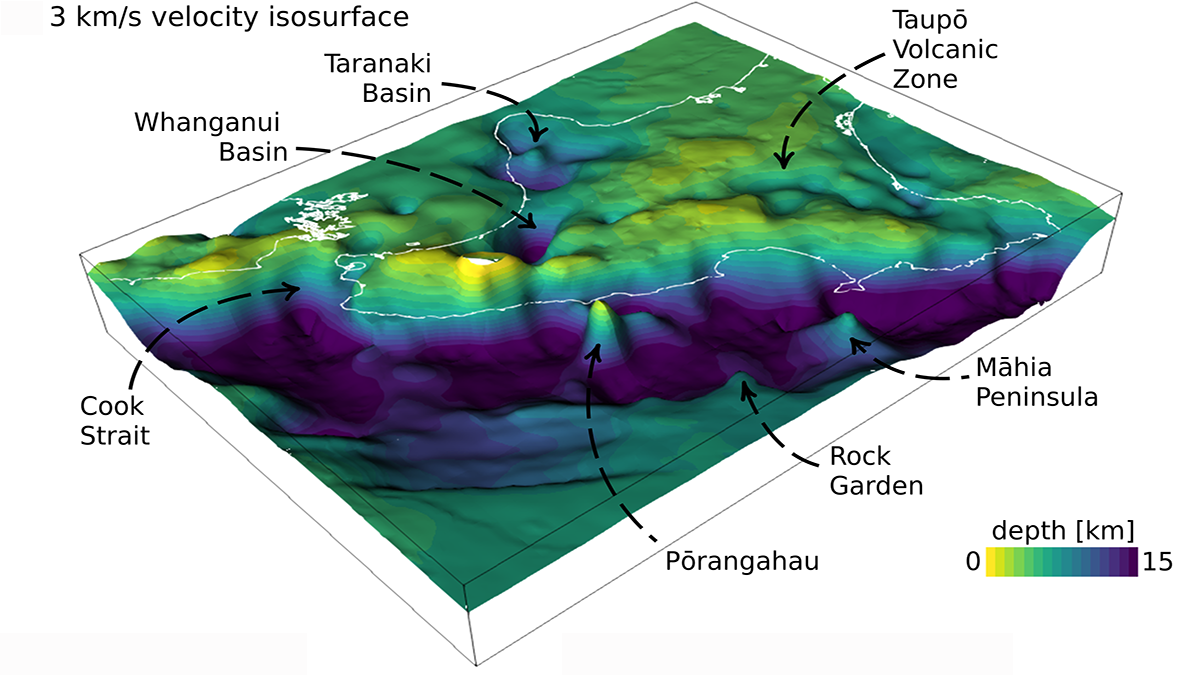
Adjoint Tomography Illuminates Hikurangi Margin Complexity
Waveform inversion of regional earthquakes reveals velocity anomalies interpreted as subducting seamounts that control an enigmatic segmentation in plate coupling along the Hikurangi margin.
![A 3-D image of the study area of Liu et al. [2022] in Kuuguluk River at Salluit, Nunavik (Quebec), Canada. The image shows the locations of A-A’ and B-B’ and lines C1-5.](https://eos.org/wp-content/uploads/2022/04/2021WR031630-Figure-4.png)
Posted inEditors' Highlights
Why is Permafrost Groundwater Surfacing?
Hydrogeological properties of degrading permafrost come to fruition with a new 3-D modeling study that highlights the increasing role of groundwater in the water cycle of high-latitude areas.
Posted inEditors' Highlights
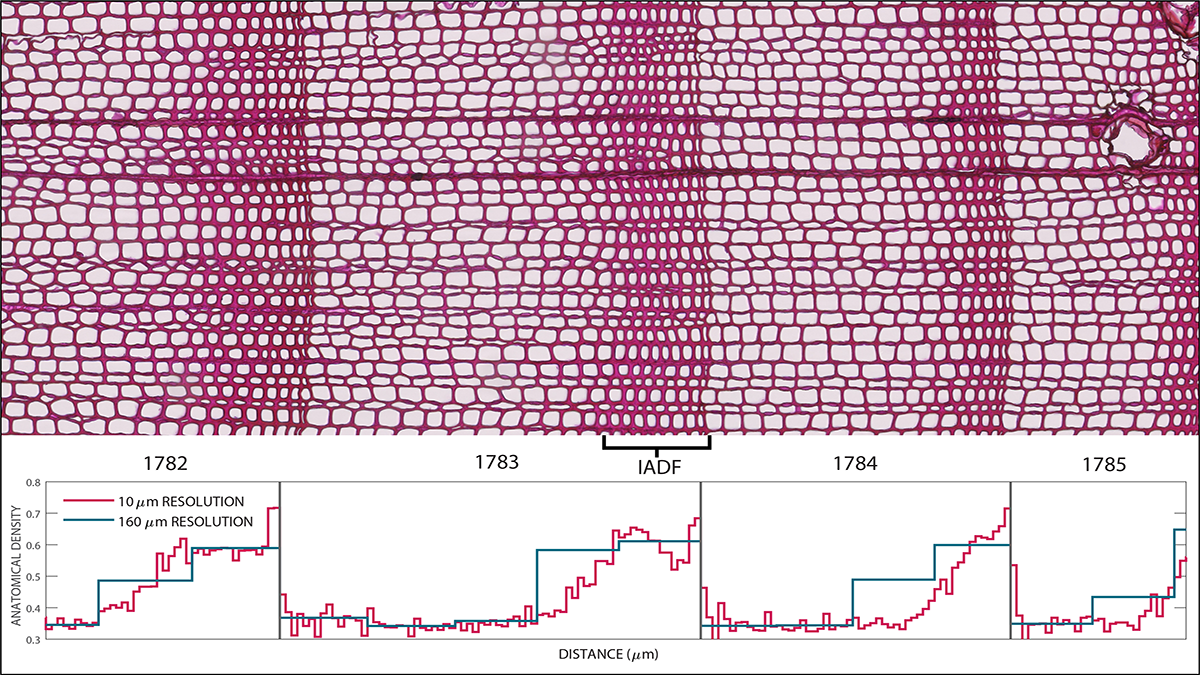
How Hot Was the Summer of 1783 Really? Trees Tell Tales
Volcanoes, heat waves, and tree rings – getting the seasonal story straight – a new study finds that volcanic fog lowered summer tree ring density despite the heat.
Posted inEditors' Highlights
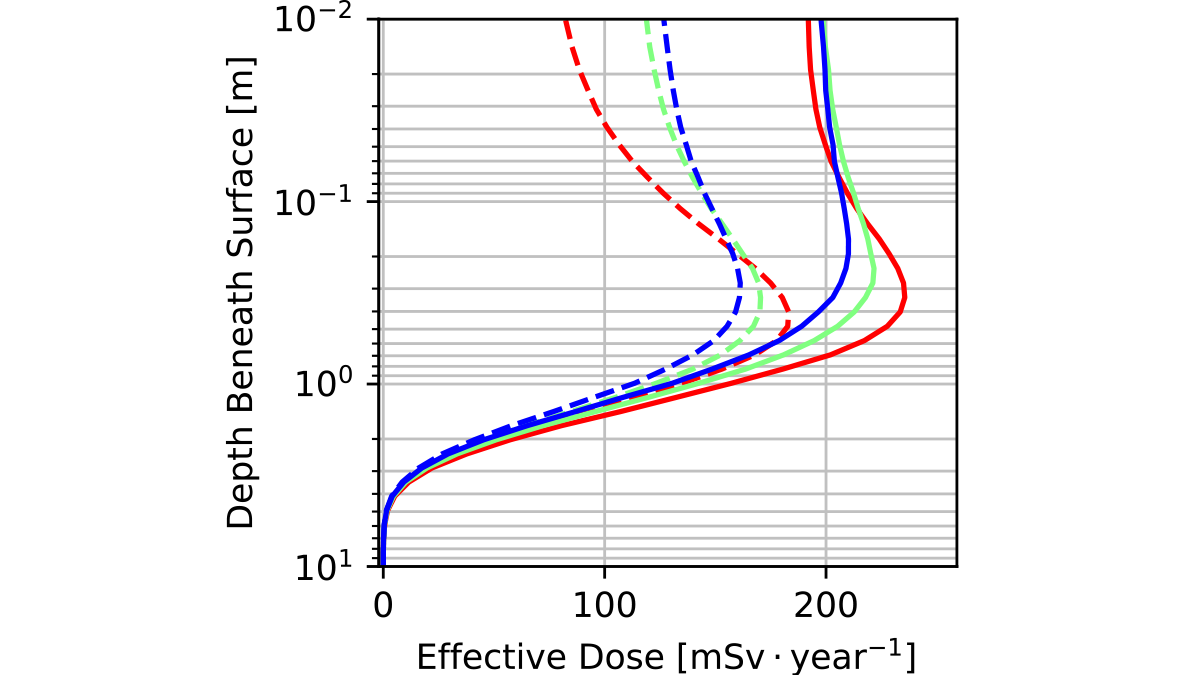
Life on Mars? Estimating Radiation Risks for Martian Astronauts
New research suggests that to minimize radiation risk for human exploration of Mars, astronauts will need to dig deep for safety.

Posted inEditors' Highlights
Extreme Lithium Isotope Fractionations During Intense Weathering
Extreme lithium fractionation is observed when primary minerals in andesite are transformed to secondary clay minerals and then to oxides with intensive chemical weathering in a tropical climate.
Posted inEditors' Highlights
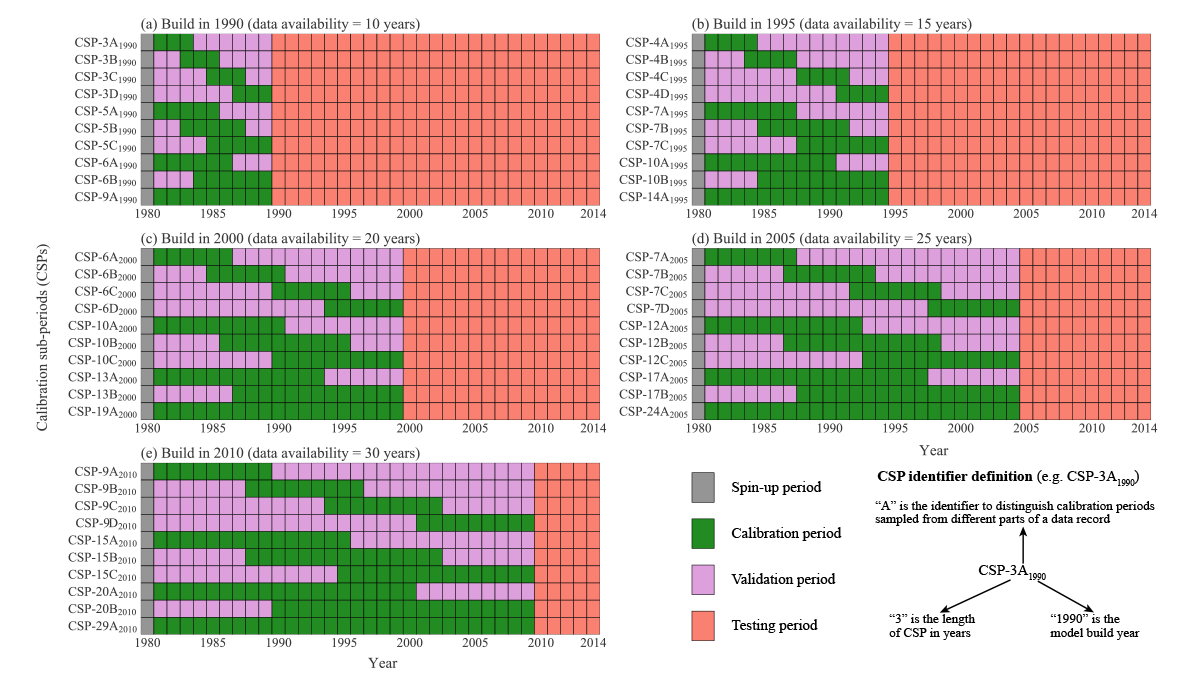
Hydrologists Should Reconsider How They Calibrate Their Models
A new study suggests that the commonly used split sample approach in hydrology, where time series are divided into a part for model calibration and a part for model validation, should be abandoned.
Posted inEditors' Highlights
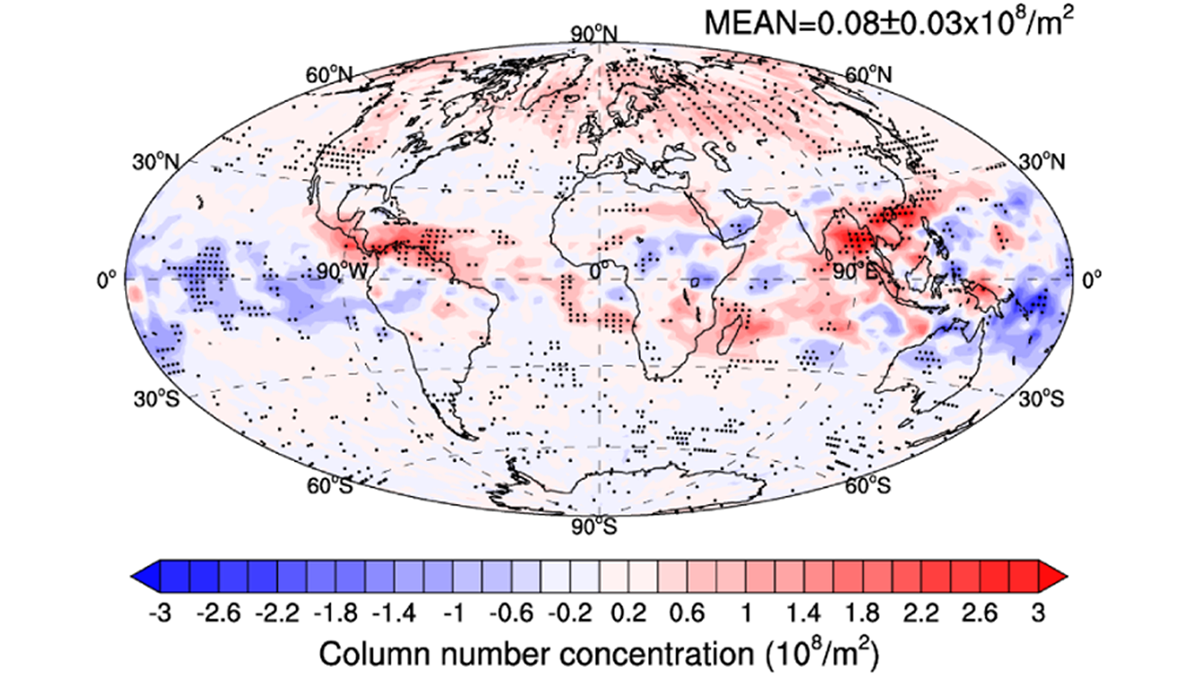
Less Air Travel May Partially Contribute to Global Warming
Decrease in aircraft soot emission, as shown by COVID-19 lockdown, leads to a significant increase in ice crystal number in cirrus clouds, and results in a small global positive radiative effect.
Posted inEditors' Highlights
New Results Deepen the Mystery of Earth’s Early Magnetic Field
How was Earth’s early magnetic field produced? New experimental results and modeling show that the energy source could not have come from exsolution of lithophile elements from the core.