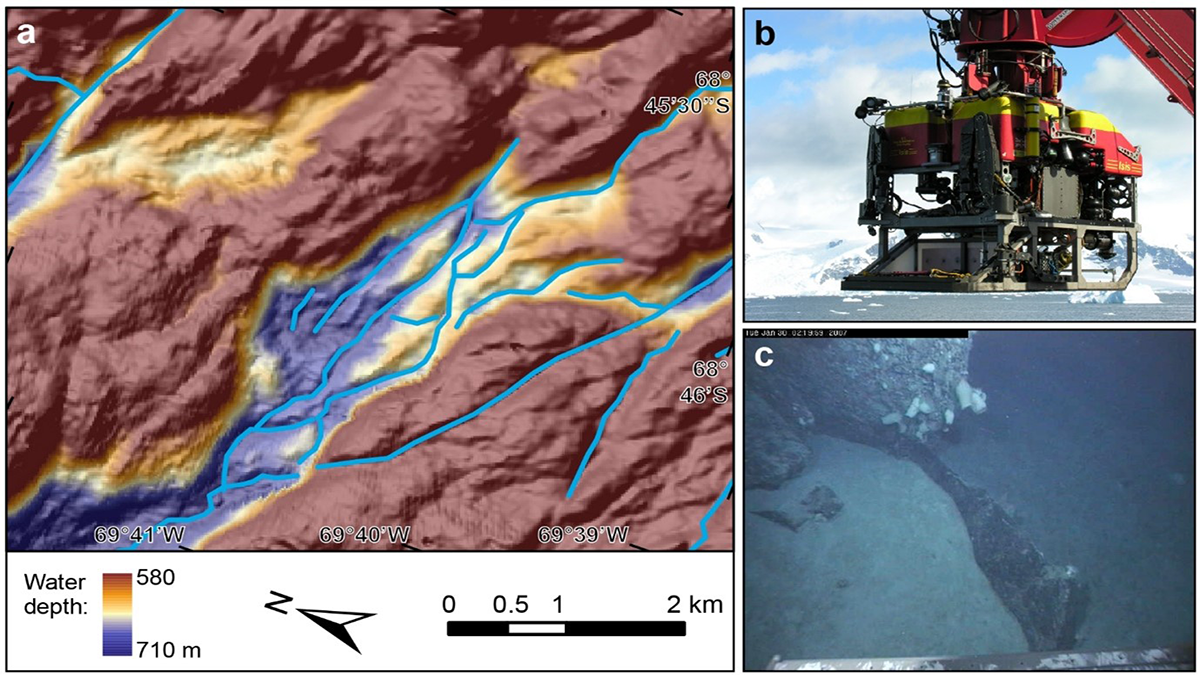
Analyses of new shipboard and ROV observations of bedrock channels carved by floods and outbursts from subglacial lakes under Antarctica shed light on complex subglacial processes.
Editors’ Highlights
Posted inEditors' Highlights
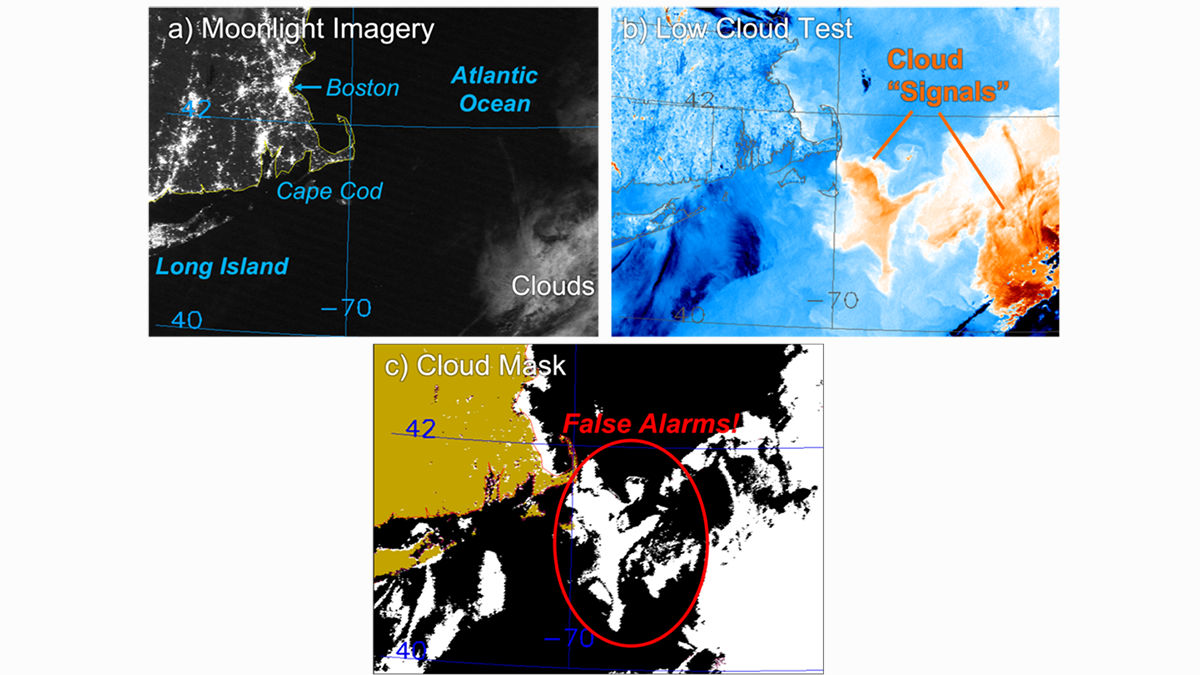
When Less is More—The Moon Sheds Light on Clouds at Night
Shining light into the dark reveals the unseen, but in some cases, it changes our perception of reality. Through moonlight we learn how the environment tricks our ways of finding nocturnal clouds.
Posted inEditors' Highlights
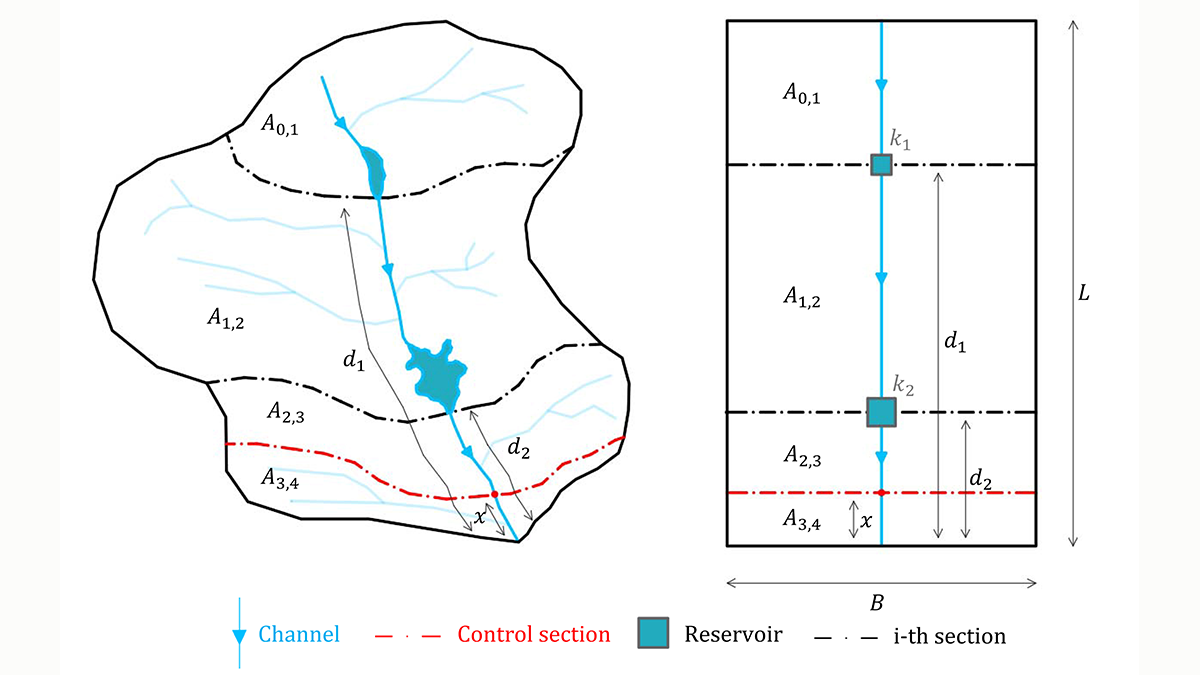
A New Index to Assess Multiple-Reservoir Effects on Peak Floods
A simple, yet quantitative, index is demonstrated to quantify reductions in the peak flood resulting from multiple reservoirs, arranged in series along the same river reach.
Posted inEditors' Highlights
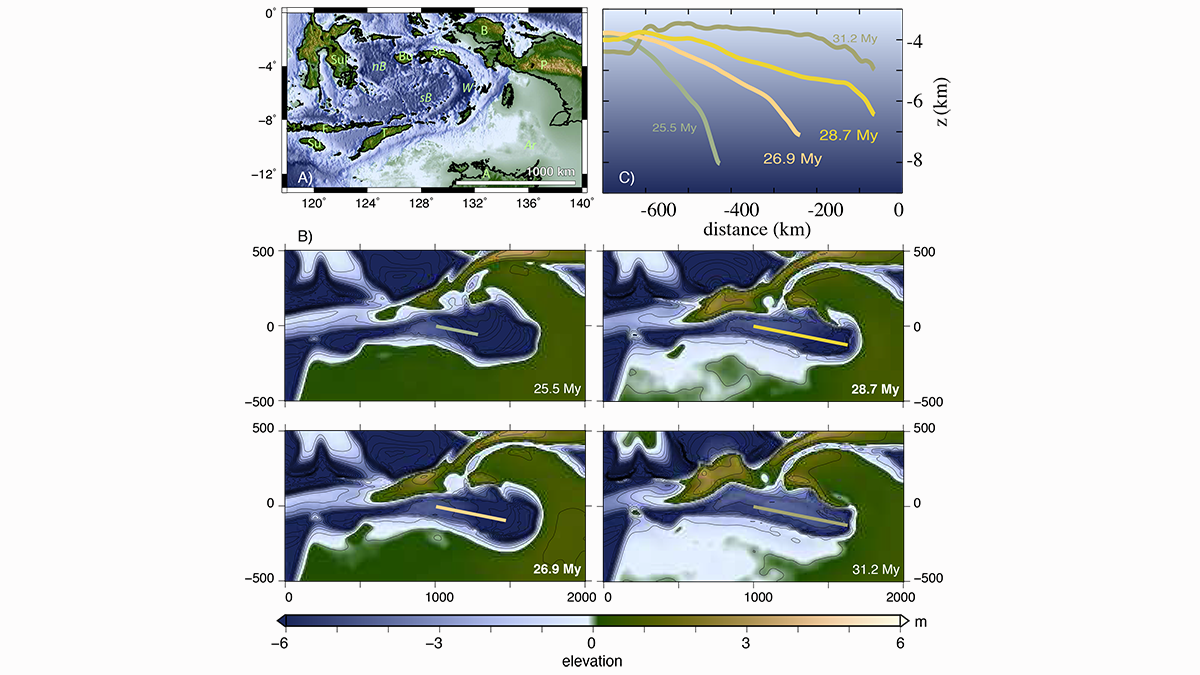
Transient Mantle Flow Triggers Morphotectonic Activity in Asia
Changes in mantle dynamics following the Australian collision in southeast Asia triggered fast and intense morphotectonic activity at the surface.
Posted inEditors' Highlights
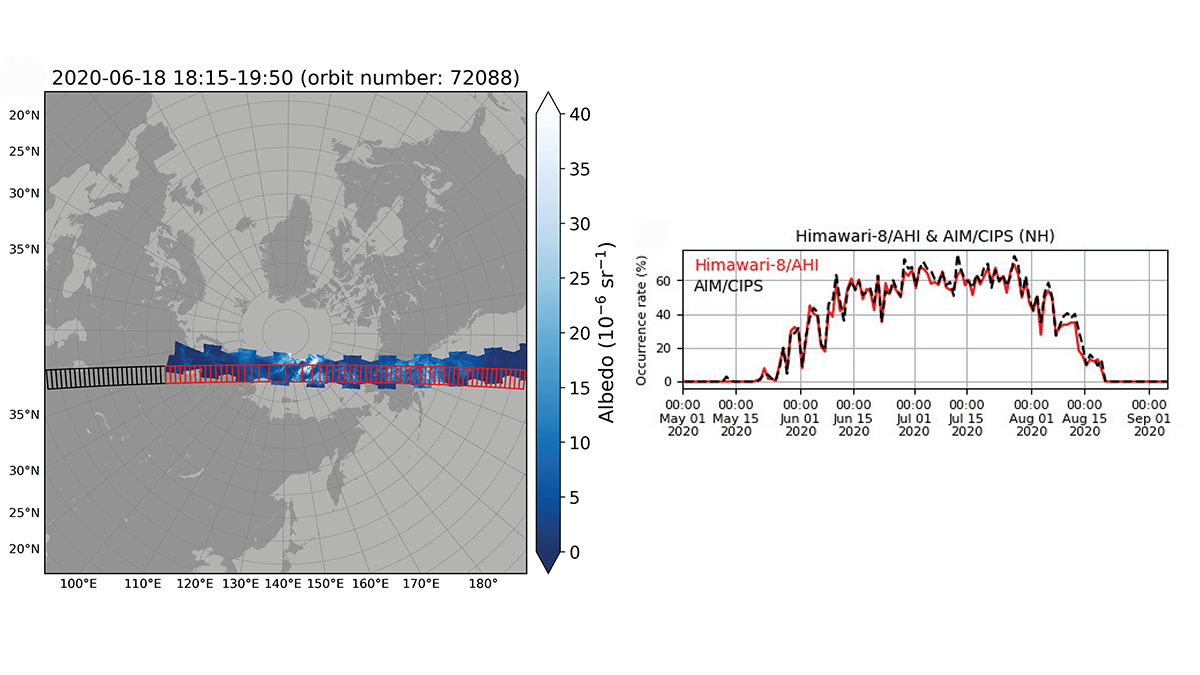
New Technique Improves Polar Mesospheric Cloud Data Set
A new two-step Polar Mesospheric Cloud detection technique is applied towards the Himawari-8/Advanced Himawari Imager full-disk images leading to a new high-quality dataset.
Posted inEditors' Highlights
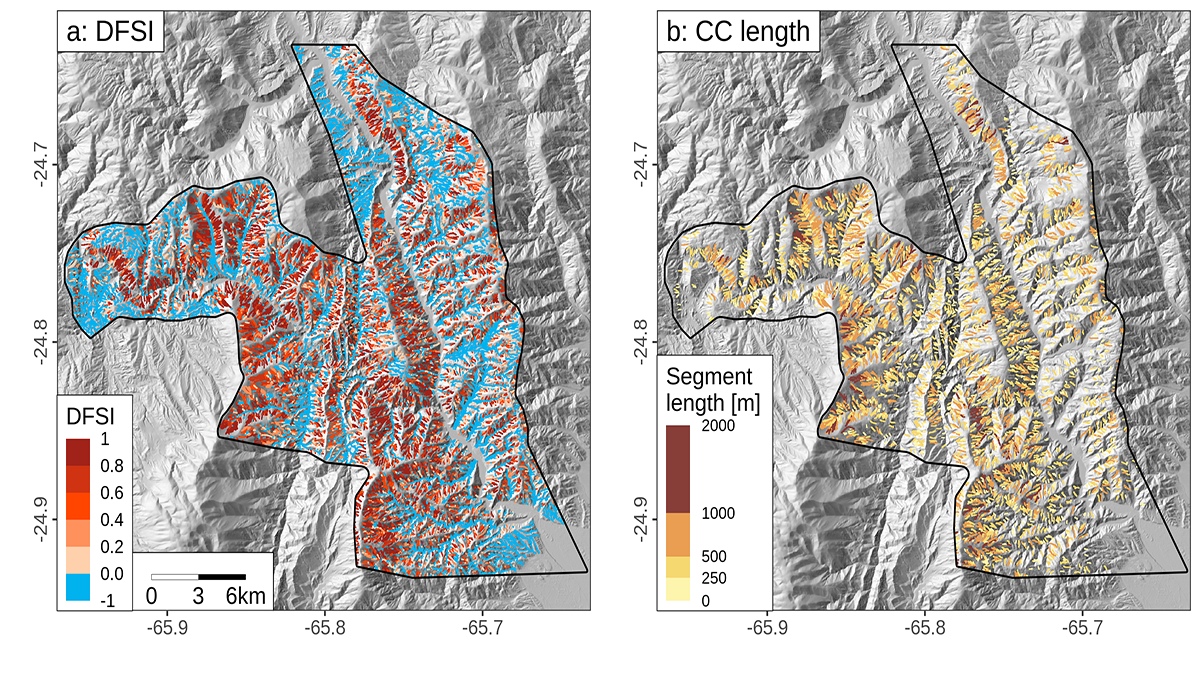
Debris Flows Keep the Landscape on the Straight and Narrow
New methods for identifying debris flow-shaped channels improve hazard quantification and highlight how high uplift rates and fractured bedrock facilitate debris flow-dominated landscape evolution.

Posted inEditors' Highlights
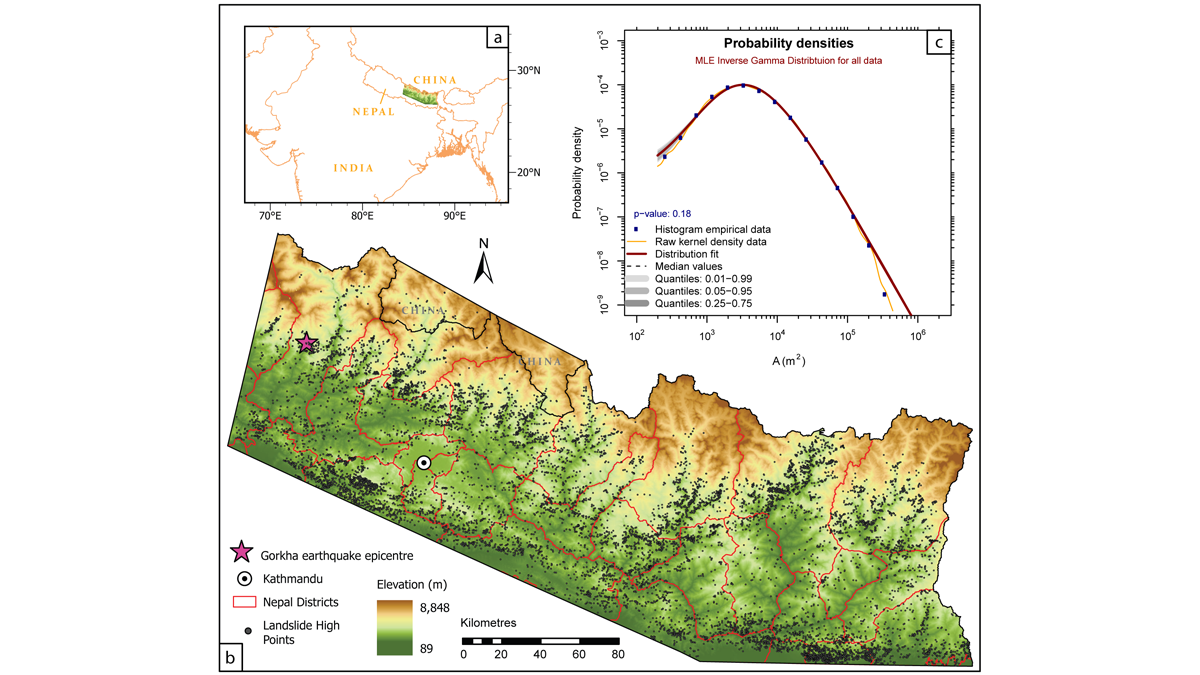
Moving Earthquake-Generated Sediment Through a Landscape
Ten years after the Wenchuan earthquake, most of the new sediment it produced remained on the landscape, indicating a long recovery time.
Posted inEditors' Highlights
History Matters When Gauging Hillslope Susceptibility to Failure
Using susceptibility models to forecast the potential locations of landslides is a key tool in mitigating landslide hazard, but are existing approaches appropriate in dynamic mountainous settings?

Posted inEditors' Highlights
Predicting Discharge Chemistry in Mine-Waste Rocks
Quantifying integrated hydrological processes, biogeochemical reactions, and mineralogical characteristics can help predict water quality and quantity for mine-waste rock piles.
Posted inEditors' Highlights
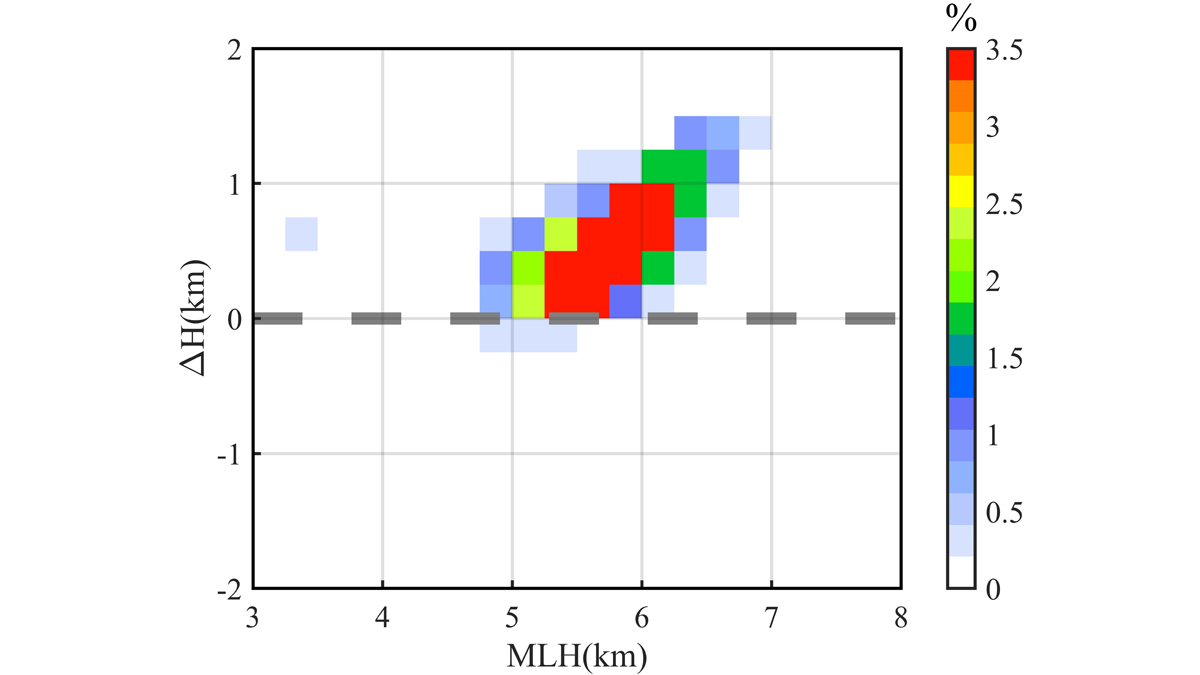
Melting Layer Characteristics of Cyclones
Dual‐frequency Precipitation Radar observations reveal the characteristics and microphysical processes of the melting layer in cyclone precipitation over the western North Pacific.