
Rich people’s aversion to flood risk results in poor people living in the most vulnerable locations poverty. Pro-poor flood risk management policies could have a significant impact on inequality.
Editors’ Highlights
Posted inEditors' Highlights
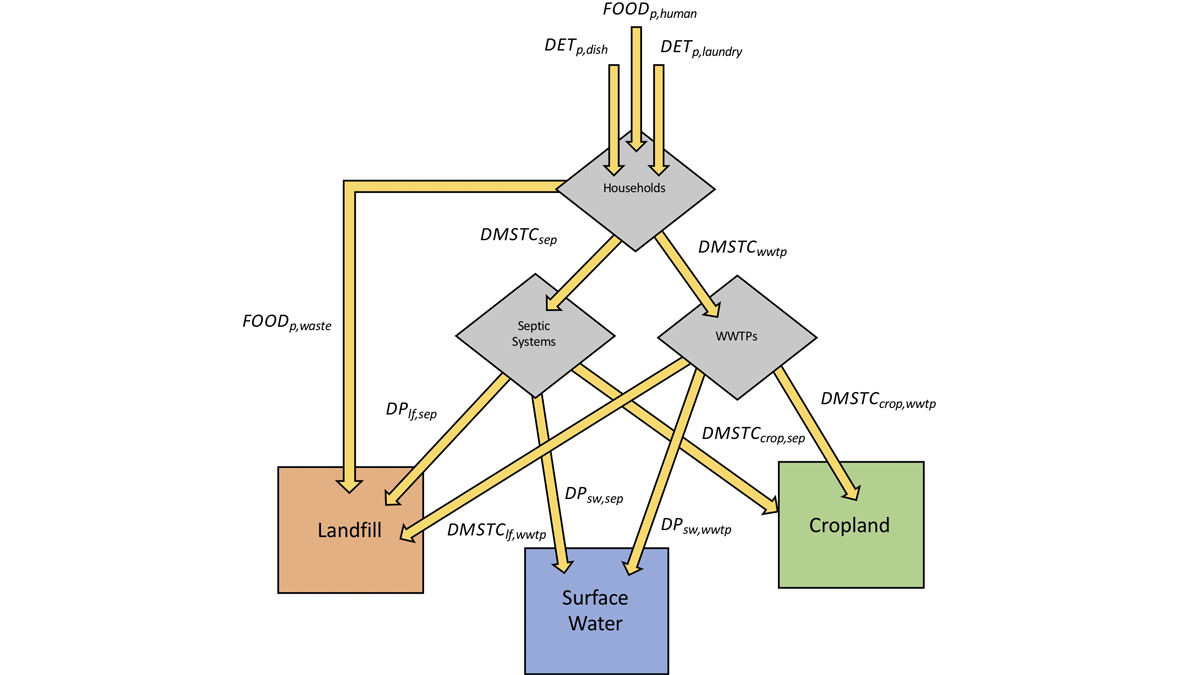
Water Quality Policy Must Consider Stored Watershed Phosphorous
Phosphorous stored in watersheds and affects water quality for decades. A new model predicts phosphorus accumulation and depletion, and the consequences for water quality conservation measures.

Posted inEditors' Highlights
American Legacy Paleosecular Variation Data Unlocked
The geomagnetic field changes regionally on centennial time scales. A recent study unlocks three historical archives from the “Four Corners” region (southwest USA) reconciling previous discrepancies.
Posted inEditors' Highlights
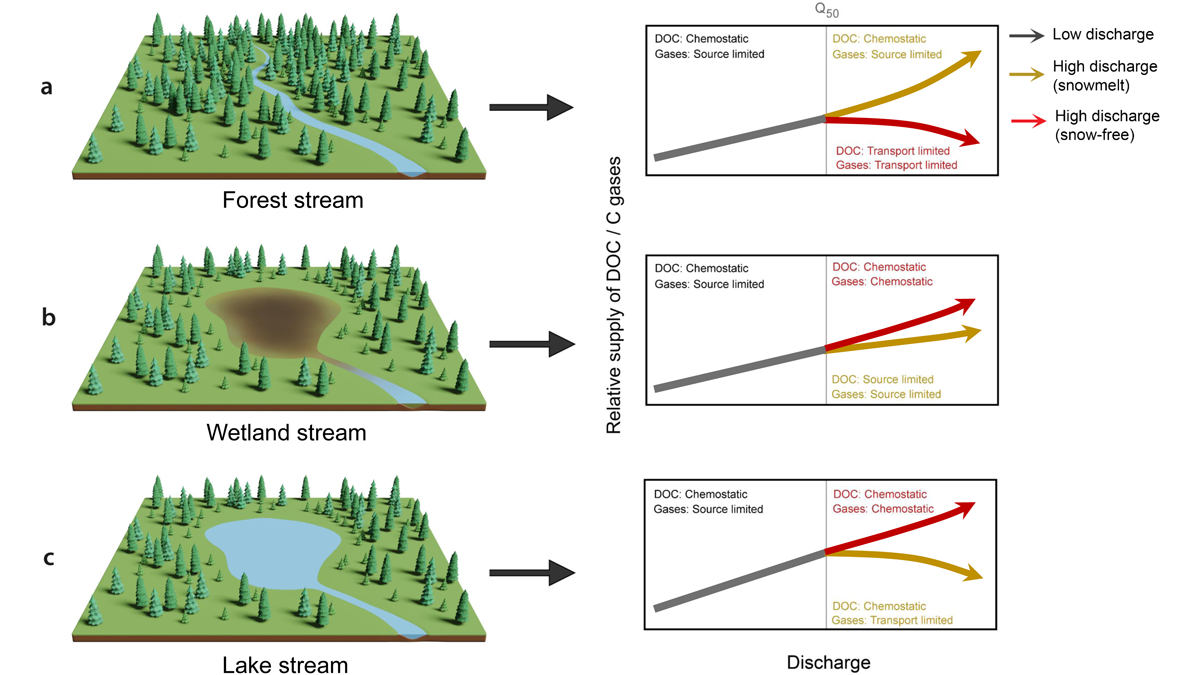
Export of Different Carbon Types from a Boreal Catchment
Carbon export in boreal catchments depends on the landscape setting and differs for snowmelt and rainfall events.

Posted inEditors' Highlights
New Standards Spur Water Utilities to Improve Compliance
Although American water utility companies take time to modify procedures and technologies in response to new quality requirements, ultimately it reduces the rate at which they violate standards.
Posted inEditors' Highlights
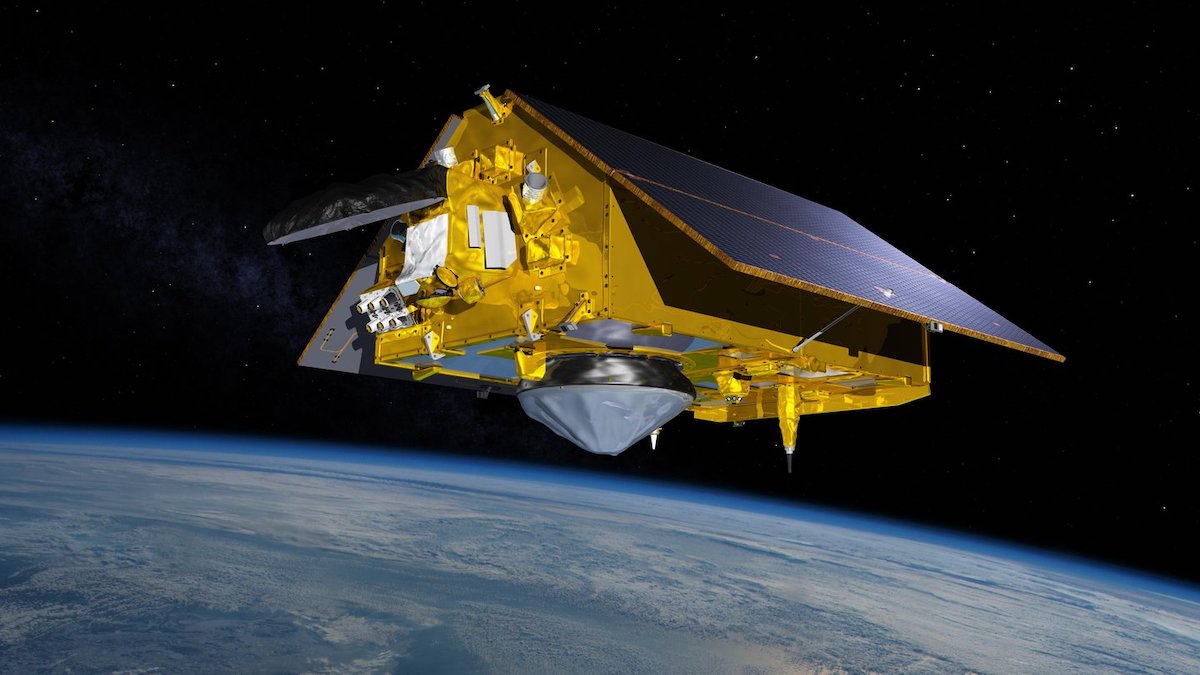
Transforming Hydrology by Integrating Sensors and Disciplines
Satellite sensing has transformed hydrology by providing global information on variables and fluxes. Breakthroughs will come from integrating sensing information and cross-disciplinary approaches.
Posted inEditors' Highlights
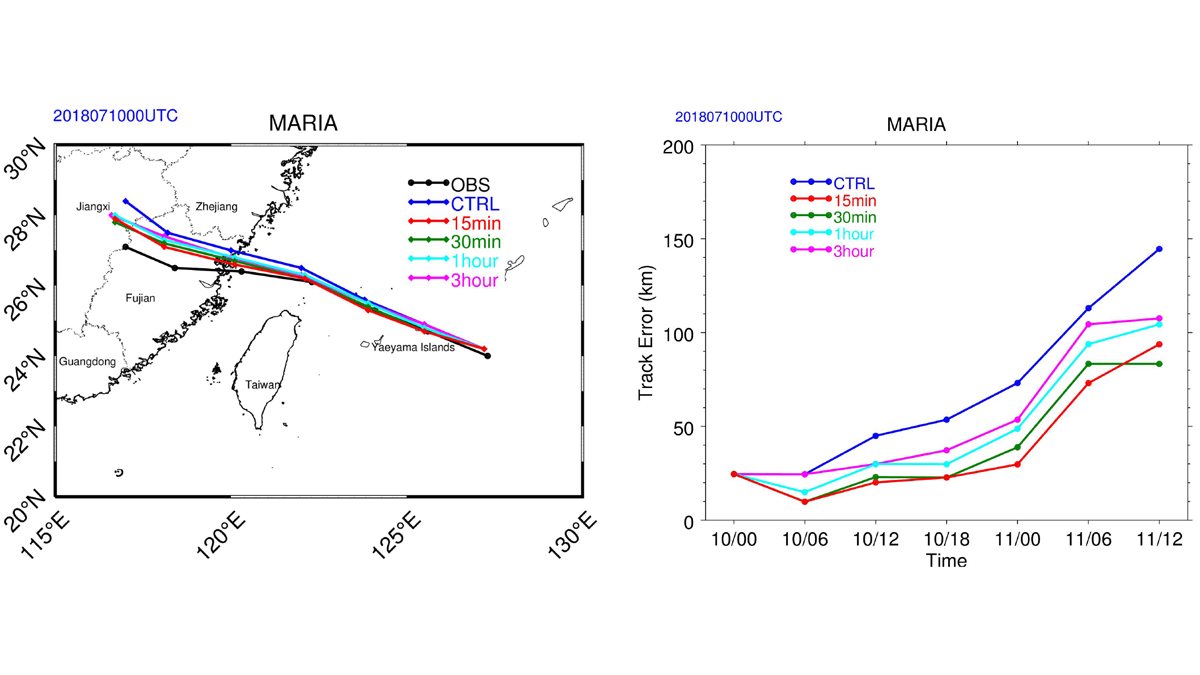
Impact of Geostationary Sounder on Typhoon Forecasts
An analysis of the impact of targeted observations from the Geostationary Interferometric Infrared Sounder at high-temporal resolution on forecasts for Typhoon Maria in 2018.
Posted inEditors' Highlights
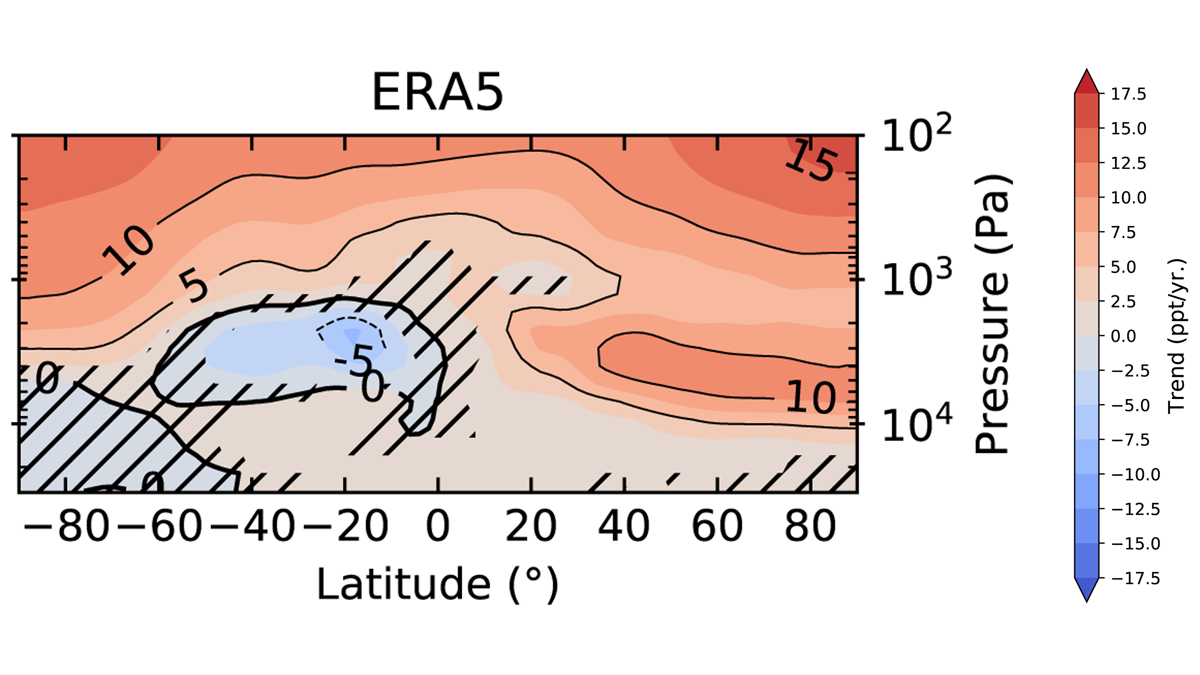
New Insights on Stratospheric Circulation from Fluorine Tracers
Stratospheric fluorine species have accumulated faster in the Northern Hemisphere over the past two decades reflecting interhemispheric differences in the Brewer-Dobson transport circulation.
Posted inEditors' Highlights
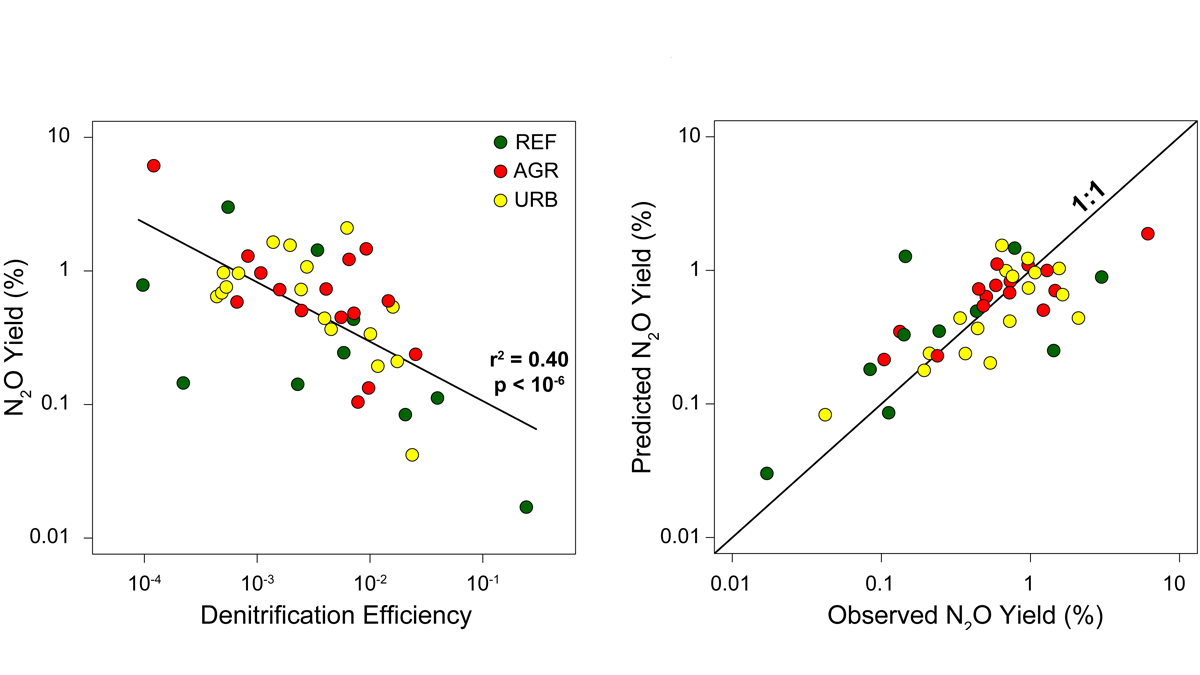
What Controls Nitrous Oxide Emissions from Rivers?
Statistical and numerical models show that denitrification efficiency is a key parameter controlling the production of N2O from rivers, providing a target for river restoration projects.
Posted inEditors' Highlights
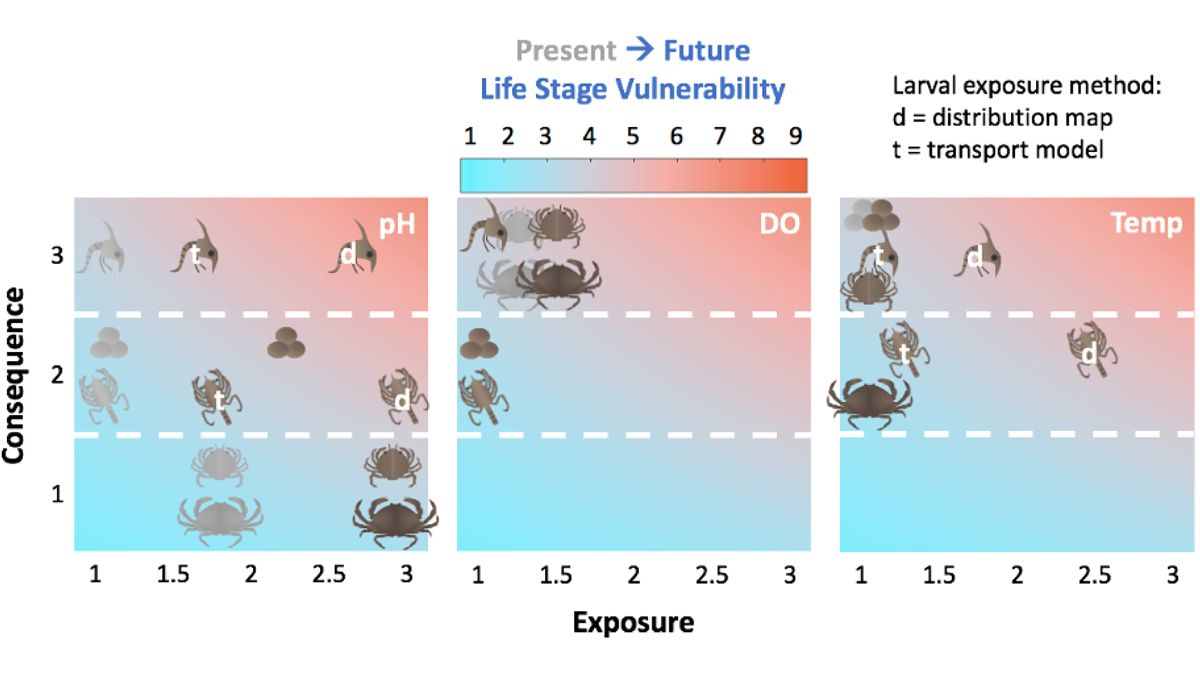
Dungeness Crab at Risk from Multiple Climate-Related Stressors
The lucrative Dungeness crab fishery is at risk because of the combined effects of projected climate-related habitat changes: lower oxygen, warming temperature, and increased acidity.