
Field kits used in Bangladesh to test arsenic exposure from contaminated drinking water are effective in comparison to expensive laboratory arsenic tests.
Editors’ Highlights

Posted inEditors' Highlights
Managing Strategic Water Resources in a Changing Climate
Another significant step has been taken in methods for managing water resources in the face of climatic changes and other future uncertainties. Dynamic adaptation is becoming a reality.
![Figure 2 from Wang and Tkalčić [2021]](https://eos.org/wp-content/uploads/2022/01/2021GL094784-Figure-2-sized-1200x675-1.png)
Posted inEditors' Highlights
Observation of Shear Wave Anisotropy in the Earth’s Inner Core
Coda-correlation wavefields reveal direction-dependent inner-core shear-wave speed, ~5 s faster in directions oblique to the Earth’s rotation axis than directions parallel to the equatorial plane.
Posted inEditors' Highlights
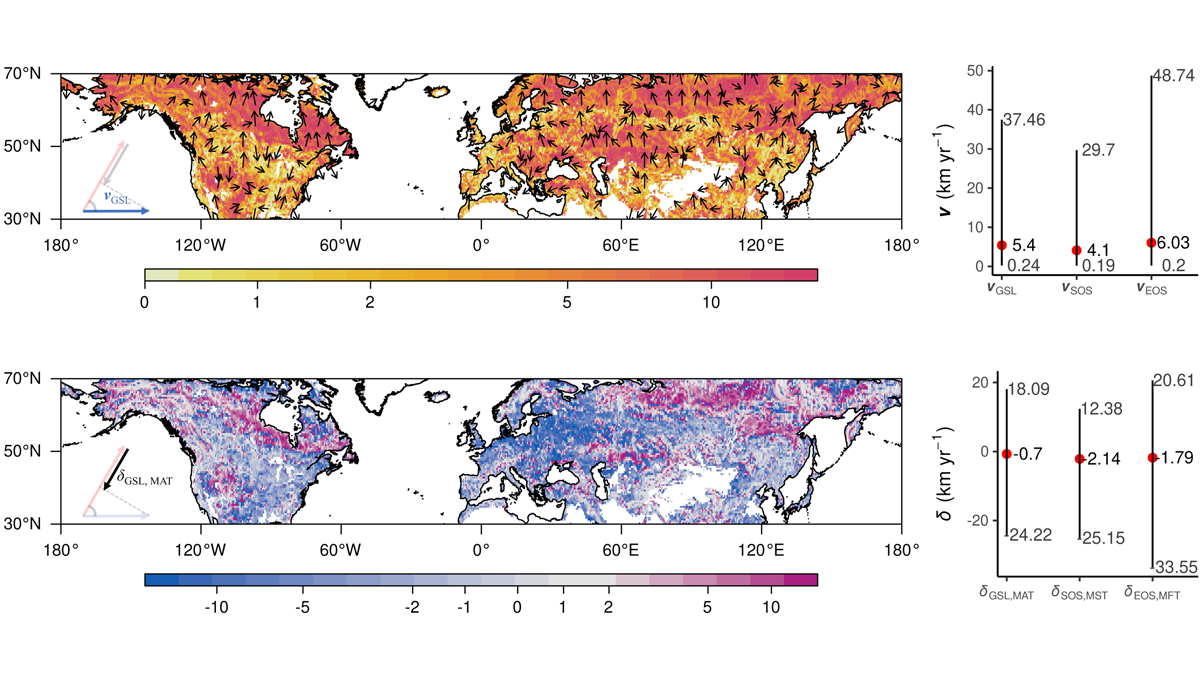
The Flowers that Bloom in the Spring (but Later)
Mismatch between the pace of climate change and crop phenology may signal a new challenge for climate change adaptation.

Posted inEditors' Highlights
Hot Lakes in a Cold Climate
Arctic warming may release less carbon dioxide from high latitude lakes but increase their climate impact by releasing more methane.
Posted inEditors' Highlights
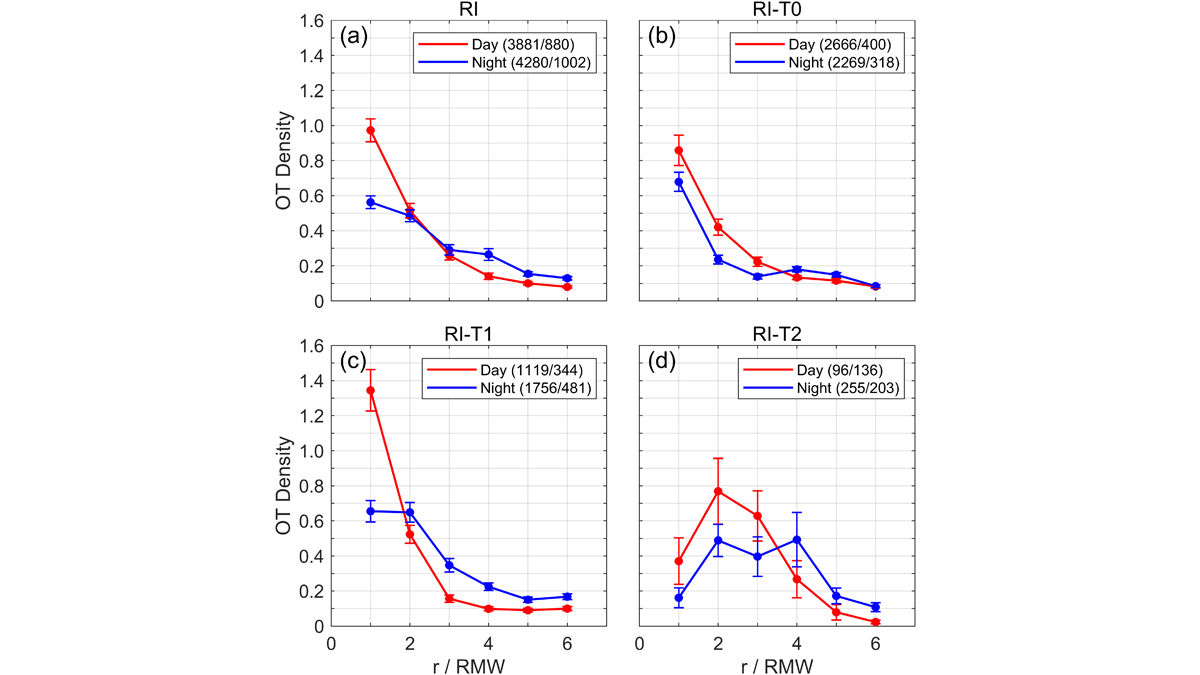
Clouds Overshooting Tops and Typhoon Intensity
An examination of the relationship between the diurnal variation of cloud overshooting tops density and typhoon intensity in 45 typhoons, using the Himawari-8 Satellite.
Posted inEditors' Highlights
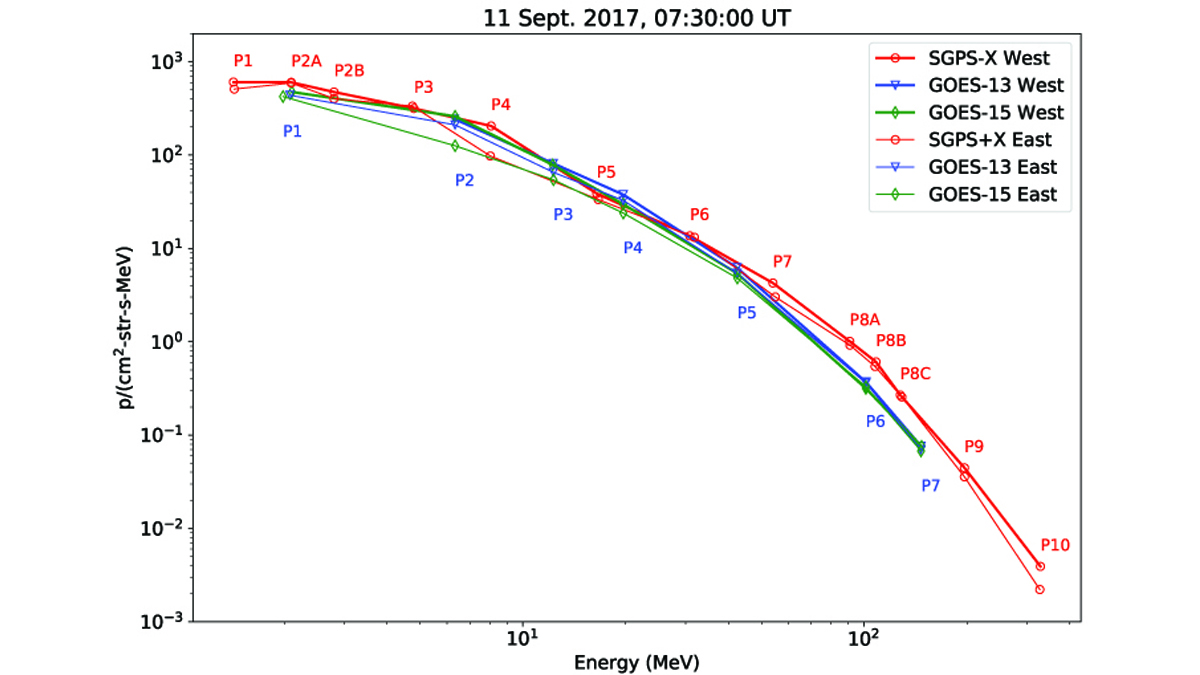
Next-Generation Solar Proton Monitors for Space Weather
NOAA’s weather satellites at geosynchronous orbit also measure space weather and a new series of instruments bring improved capabilities for monitoring and science discovery.

Posted inEditors' Highlights
Tracking from Space how Extreme Drought Impacts Carbon Emissions
Carbon dioxide emissions from wildfires combined with reduced carbon uptake by intact ecosystems during the 2019-202
0 fire season to approximately double Australia’s annual carbon emissions.

Posted inEditors' Highlights
Plant Root Exudates Mediate Soil Nutrient Transport
Plant roots mediate solute transport through the soil immediately surrounding them by introducing polymers and other binding compounds that disrupt water transport pathways between soil pore spaces.

Posted inEditors' Highlights
An Unstable Magnetic Field in Central Asia 2500-1500 Years Ago
The geomagnetic field intensity – poorly described – varies spatially and temporally on centennial time scales. A recent study fills an important gap in Central Asia and discusses global implications.