Source: Journal of Geophysical Research: Solid Earth
The b-value is widely used to characterize seismicity. It has been suggested to depend on stress and to be a potential precursor of large earthquakes. The classical estimator (GR) is based on the slope of the frequency-magnitude distribution above a completeness magnitude.
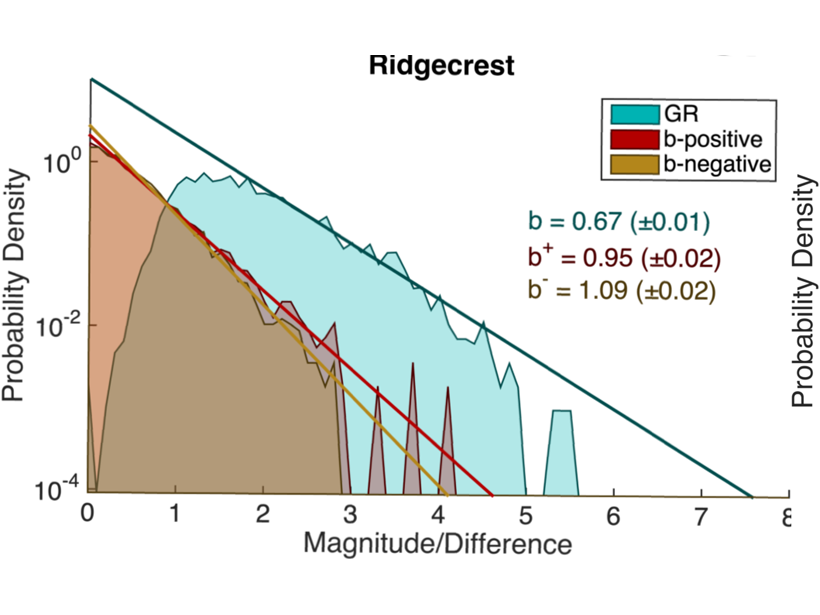
van der Elst [2021] presents a new b+ estimator that is based on the magnitude difference between successive events considering only positive values. When the completeness magnitude increases, for instance after a large earthquake, the GR estimator is under-estimated due to undetected small earthquakes, while the b+ estimator is much more robust.
This new tool confirms recent observations of low b-value in some sequences that turn out to be foreshocks. It also highlights a more complex picture than previous studies. This shows that care should be taken when interpreting the b-value as a stress-meter.
Citation: van der Elst, N. J. [2021]. B‐positive: A robust estimator of aftershock magnitude distribution in transiently incomplete catalogs. Journal of Geophysical Research: Solid Earth, 126, e2020JB021027. https://doi.org/10.1029/2020JB021027
—Agnes Helmstetter, Associate Editor, JGR: Solid Earth
Text © 2021. The authors. CC BY-NC-ND 3.0
Except where otherwise noted, images are subject to copyright. Any reuse without express permission from the copyright owner is prohibited.