
Machine learning and data on aquifer type, sediment thickness, and proxies for irrigation water use has been used to produce the most comprehensive map of land subsidence in the western U.S. to date.
Editors’ Highlights
Posted inEditors' Highlights
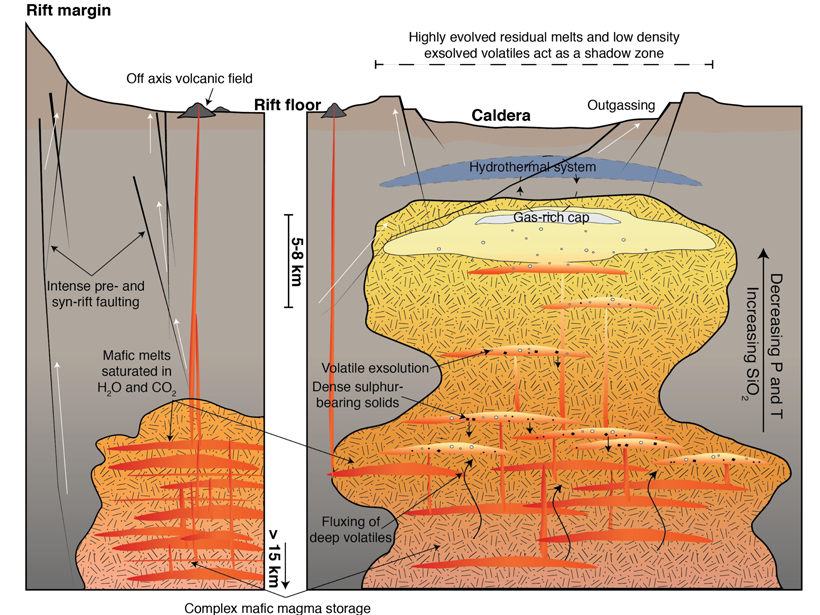
Gas-Rich, Transcrustal Magma Storage in the Main Ethiopian Rift
Increments of melt trapped in crystals reveal upper crustal magmas in the Main Ethiopian Rift are rich in water and other volatiles, leading to extensive diffuse degassing and hydrothermal systems.
Posted inEditors' Highlights
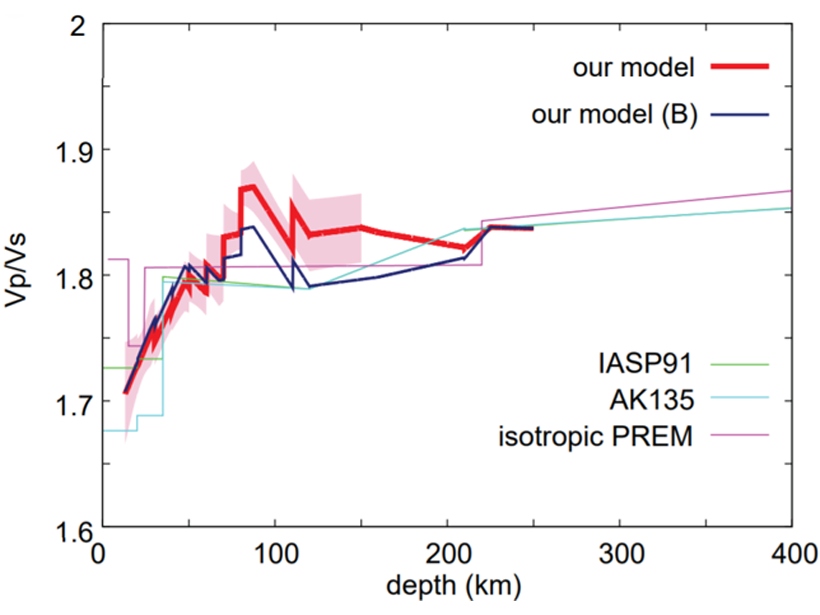
Unexpected Oceanic Lithosphere-Asthenosphere P-wave Velocities
A peak in seismic P-wave – S-wave velocity ratios at the lithosphere-asthenosphere boundary beneath old Pacific lithosphere requires an additional property besides temperature as an explanation.
Posted inEditors' Highlights
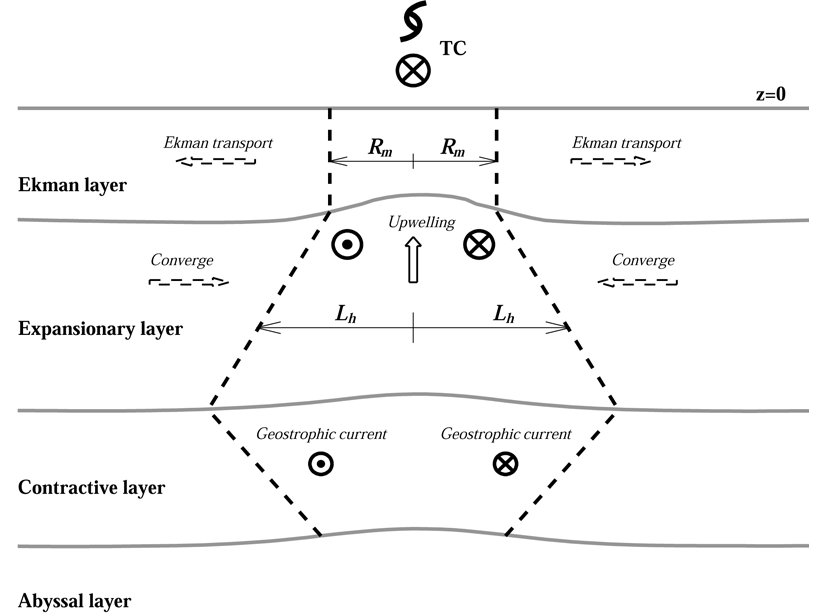
A Direct Bridge Between Tropical Cyclones and Ocean Eddies
Tropical cyclones can inject potential vorticity directly into ocean eddies—an alternative way for tropical cyclones to leave fingerprints on the ocean besides the traditional near-inertial wave.
Posted inEditors' Highlights
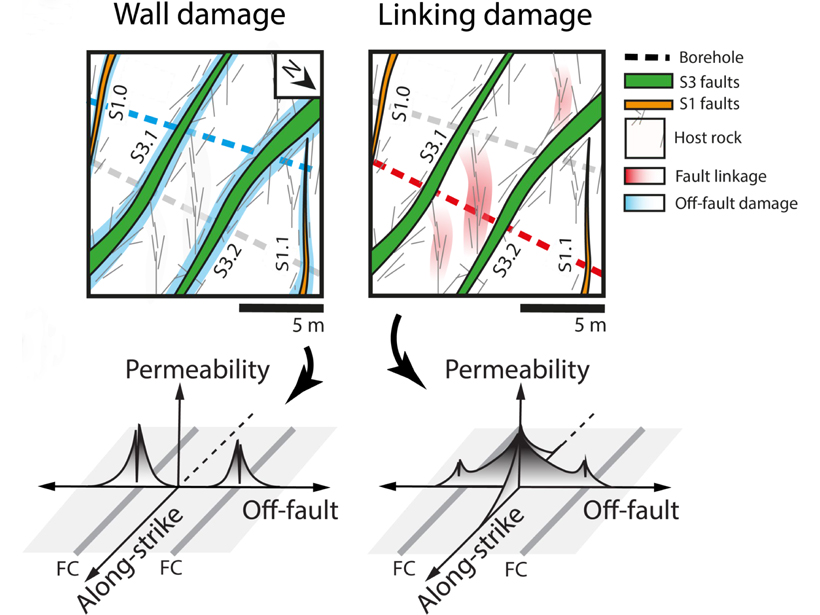
Fluctuating Fluid Flows in a Fractured Fault
Fault damage zones can focus fluid transport near faults.
Posted inEditors' Highlights
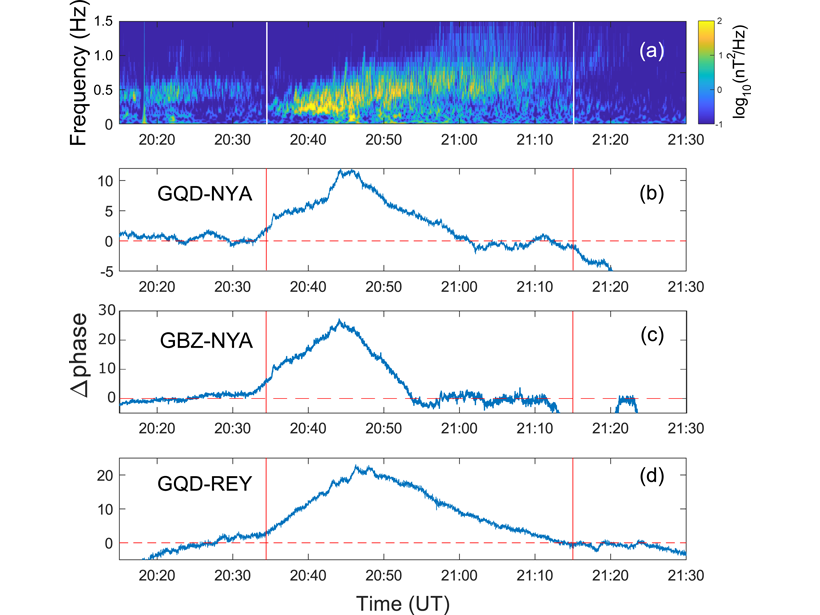
All Hands on Deck to Catch Ion Cyclotron Waves
An international armada of orbiting satellites and ground VLF network join forces to form a “magnetosphere-ionosphere observatory” to size up electromagnetic ion cyclotron waves in the magnetosphere.
Posted inEditors' Highlights
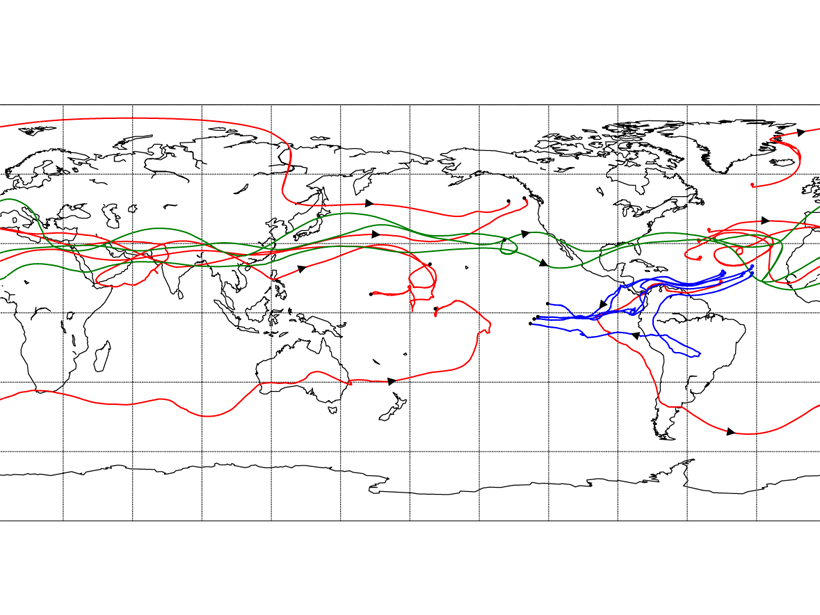
A New Perspective on a Classic Climate Conundrum
The Lagrangian method applied to tracking water transport between the Atlantic and Pacific basins reveals a larger contribution by mid-latitude westerly winds across Eurasia than previously thought.
Posted inEditors' Highlights
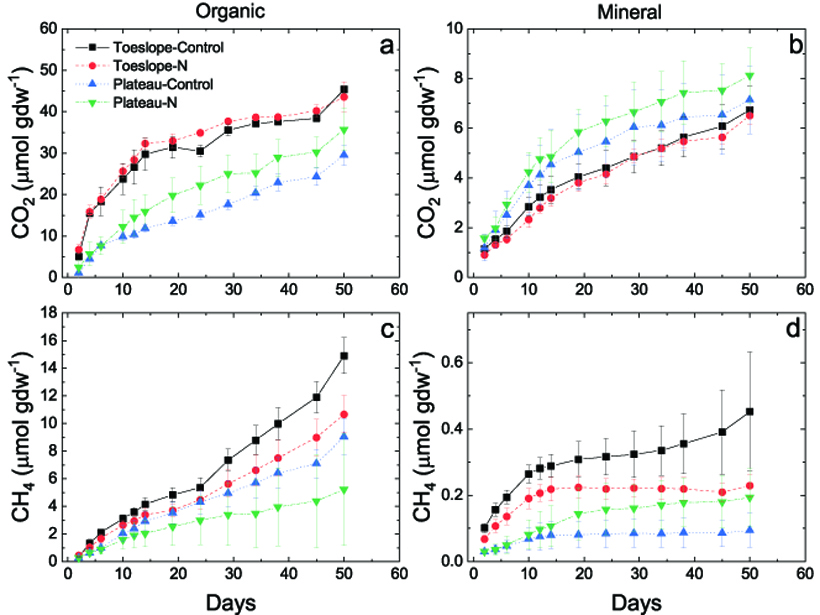
Downhill from Here: Landscape Positions and Greenhouse Emissions
In comparing soils from two tundra wetland landscape positions, landscape position is found to matter, and toeslopes are associated with higher greenhouse gas production.
Posted inEditors' Highlights
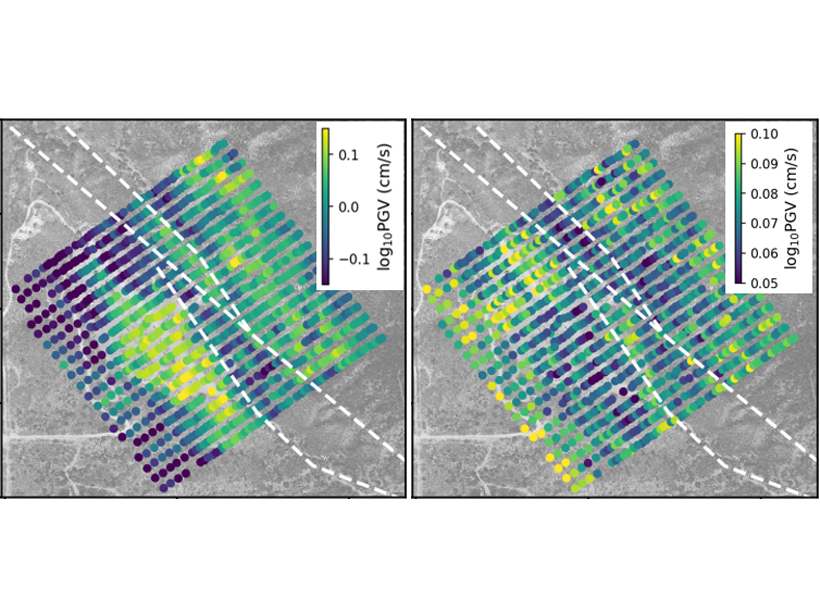
Super Dense Array Measurement Magnifies Seismic Wavefields
An investigation of small-scale spatial variability in earthquake ground motions helps to quantify the uncertainty of ground motions in probabilistic seismic hazard analysis.
Posted inEditors' Highlights
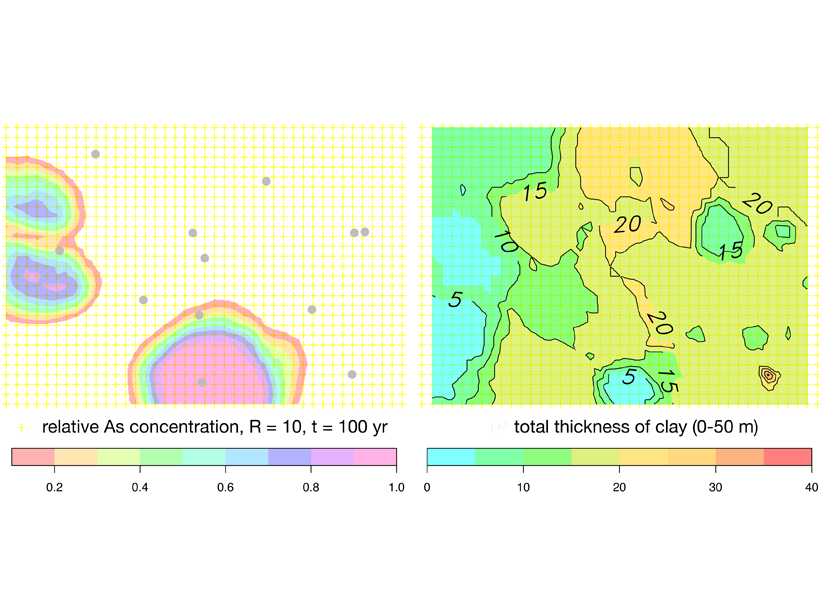
Arsenic Pollution in Bangladesh is Catching Up with Deeper Wells
Inhabitants of Bangladesh have deepened drinking water wells to avoid extracting arsenic-rich groundwater from shallow aquifers, but these may not be free from pollution either.