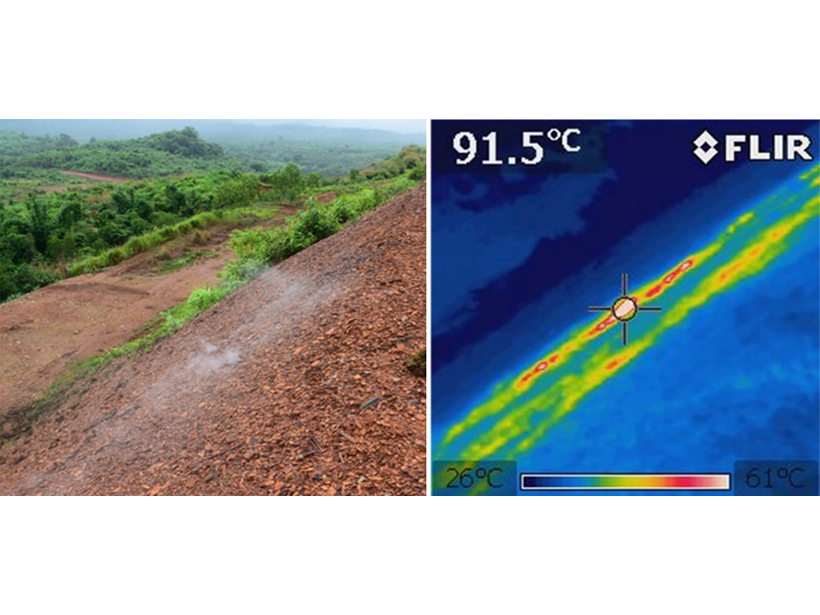
A community-based citizen science study on spontaneously combusting coal-mine waste heaps in Myanmar underpins the development of risk management plans to protect individuals and communities.
Editors’ Highlights
Posted inEditors' Highlights
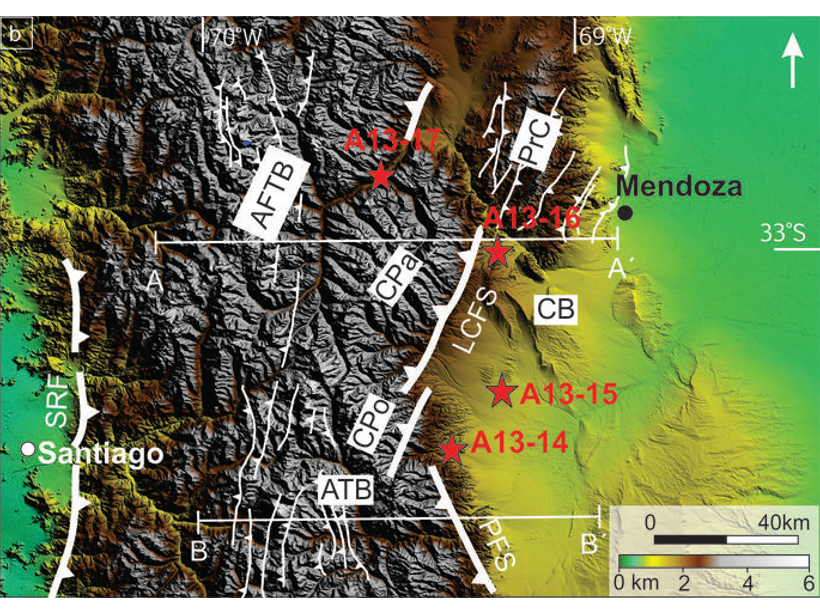
What Controlled the Growth of the Southern Central Andes?
Flat-slab subduction appears to have played a minor role in the growth of the Southern Central Andes, with evidence for eastward migrating deformation.
Posted inEditors' Highlights
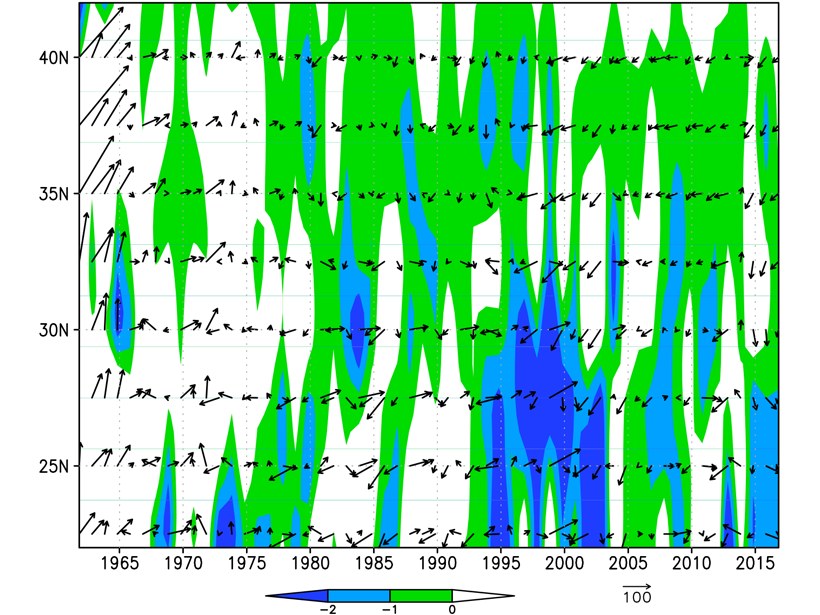
Meiyu: The Dragon Dictating Rainfall Variability in East Asia
According to Chinese myth, rain is water poured out of a dragon; in reality is the Meiyu that dictates rainfall in eastern Asia, producing rain belts jumping from south in spring to north in summer.

Posted inEditors' Highlights
A Global View of Shapes and Sizes of Ice Crystals in Cloud Tops
Ice particles have systematic covariations and temperature dependences that are surprisingly consistent with a simple ice growth theory as revealed by satellites.
Posted inEditors' Highlights
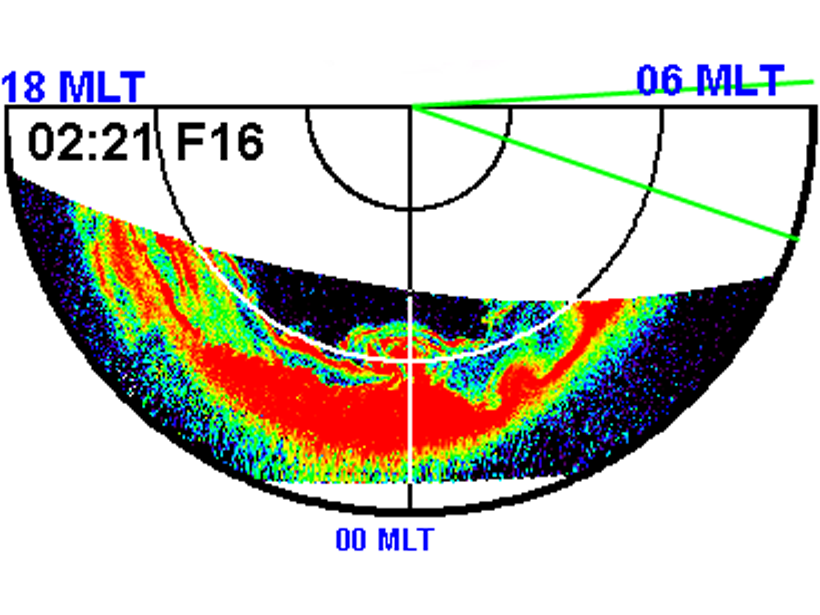
Power Outage When the Aurora Throws a Curve Ball
Omega-band aurora carries fast propagating electric currents in the azimuthal direction, producing geomagnetically induced currents that can cause power outage on the ground beneath.
Posted inEditors' Highlights
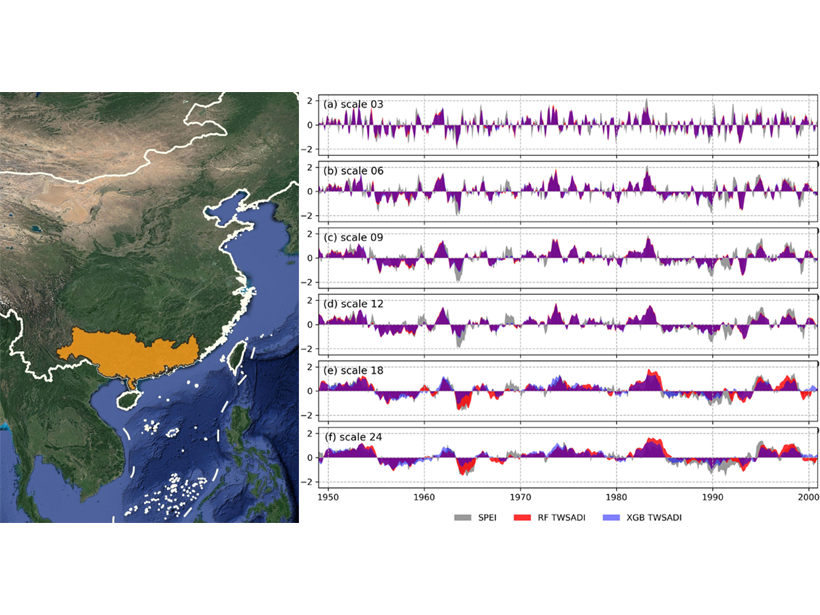
Ensemble Learning Estimates Terrestrial Water Storage Changes
Ensemble learning models for estimating past changes of terrestrial water storage from climate are presented and tested in the Pearl River basin, China.
Posted inEditors' Highlights
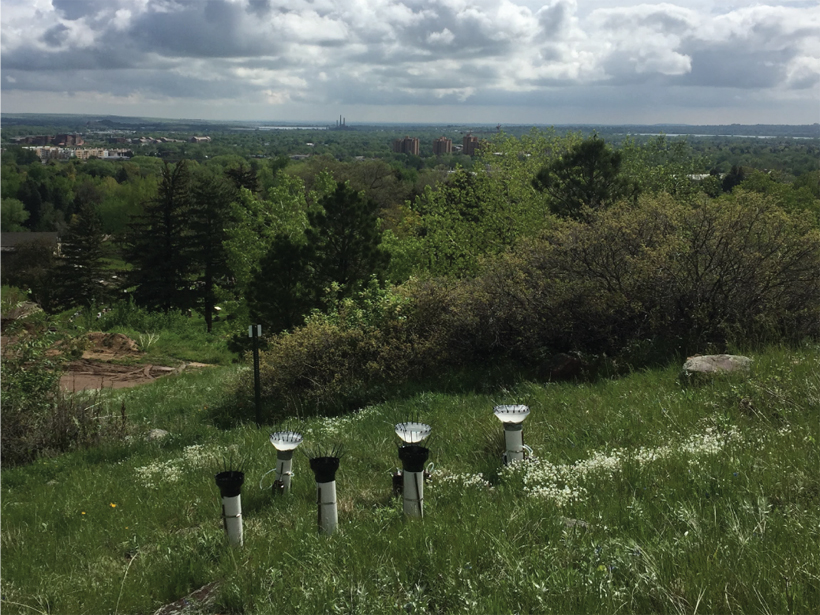
Dust in the Wind: Human Impacts to the Colorado Front Range
A recent increase in airborne dust has been attributed to both climate and land use, with human activity playing a substantial role, especially in summertime at low elevations.

Posted inEditors' Highlights
Is Space Weather Worse by the Sea?
A new simulation of space-weather driven geoelectric fields at the land/sea conductivity boundary shows how these fields are magnified by both coastal effects and inhomogeneous land conductivity.

Posted inEditors' Highlights
The Perils of Computing Too Much and Thinking Too Little
Big steps forward are synonymous with new ideas – a thought that merits mindfulness if we aspire to train students to do more than merely train machines.
Posted inEditors' Highlights
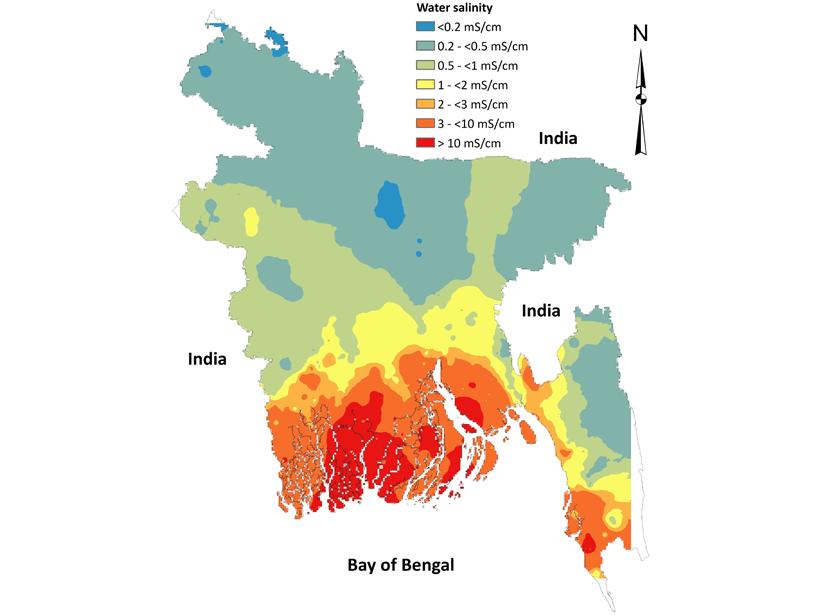
Does Drinking Water Salinity Affect Child Mortality?
An association between drinking water salinity and neonatal and infant mortality in Bangladesh indicates the critical role of water salinity on child health.