Source: Geophysical Research Letters
Geological observations of fault ruptures are naturally made after the earthquake – an earthquake occurs, and we flock to the field to capture important data regarding what moved and by how much, and to understand what that tells us about how earthquakes work. Such observations involve uncertainty because it is often not known what the ground surface around the fault looked like before the earthquake; hence, while we can confidently reconstruct broad scale motions along the fault, understanding how the ground surface around the fault responded to the earthquake is more difficult to reconstruct.
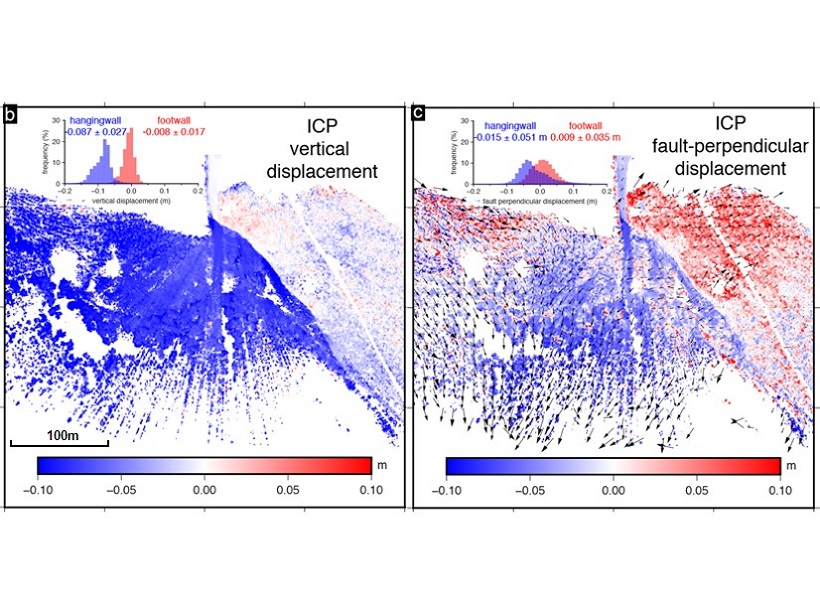
Wedmore et al. [2019] analyze the first known example of an earthquake rupture captured using pre- and post- images of the ground surface, using a technique called terrestrial laser scanning. By differencing the two images, the scientists constructed a very high-resolution glimpse of a small section of the 2016 Magnitude 6.6 earthquake rupture in Norcia, Italy, to centimeter-scale precision.
This analysis allows the authors to analyze how off-fault deformation is distributed around the fault, with some surprising results. Vertical deformation predominantly (84%) occurs on the discrete fault surface, with off-fault deformation (16%) limited to a narrow zone about 4 meters wide. On the other hand, 50% of horizontal deformation occurs off the fault, in a zone about 8 meters wide. This partitioning of off-fault deformation has not been observed before and will help to refine our understanding of what happens in the vicinity of a seismic fault during rupture.
Citation: Wedmore, L. N. J., Gregory, L. C., McCaffrey, K. J. W., Goodall, H., & Walters, R. J. [2019]. Partitioned off‐fault deformation in the 2016 Norcia earthquake captured by differential terrestrial laser scanning. Geophysical Research Letters, 46. https://doi.org/10.1029/2018GL080858
—Gavin P. Hayes, Editor, Geophysical Research Letters
Text © 2019. The authors. CC BY-NC-ND 3.0
Except where otherwise noted, images are subject to copyright. Any reuse without express permission from the copyright owner is prohibited.