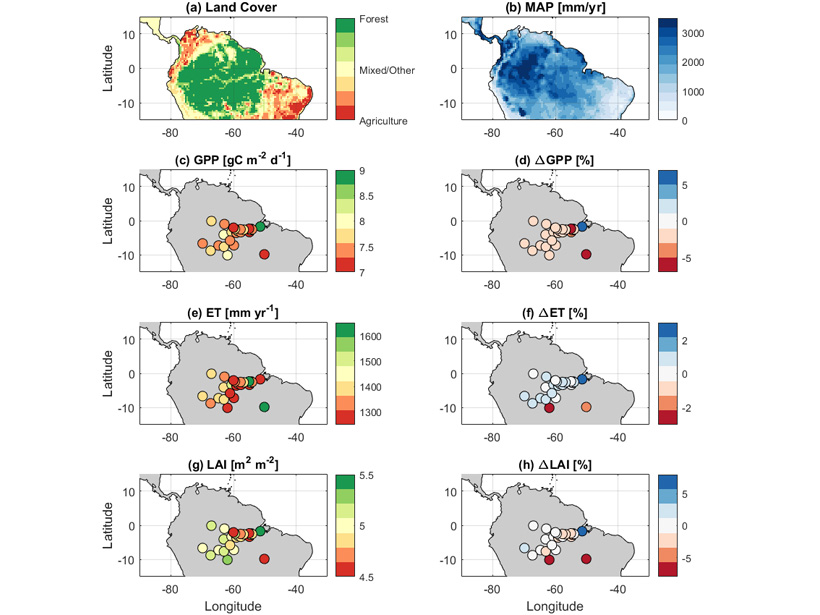
Source: Journal of Geophysical Research: Biogeosciences
Humid tropical forests often stay quite green during the dry season. This dry season “greening” is a contentious topic in the scientific literature because it implies that tropical forests are not water limited even though periodic droughts have caused declines in carbon storage. Manoli et al. [2018] use a simple scheme of plant phenology (leaf development) to resolve the mechanisms associated with the observed greening. They demonstrate that accounting for phenological patterns of leaf production provides a way for forests to withstand all but the most intense droughts, which is consistent with observations. By reconciling the well-recognized impacts of drought on tropical forest function with the observed dry season “green-up,” these findings are a major contribution to our understanding of the carbon balance in tropical forests.
Citation: Manoli G., V.Y. Ivanov, and S. Fatichi. [2018], Dry season greening and water stress in Amazonia: the role of modeling leaf phenology, Journal of Geophysical Research: Biogeosciences, 123. https://doi.org/10.1029/2017JG004282
—George Vourlitis, Associate Editor, JGR: Biogeosciences
Text © 2018. The authors. CC BY-NC-ND 3.0
Except where otherwise noted, images are subject to copyright. Any reuse without express permission from the copyright owner is prohibited.

